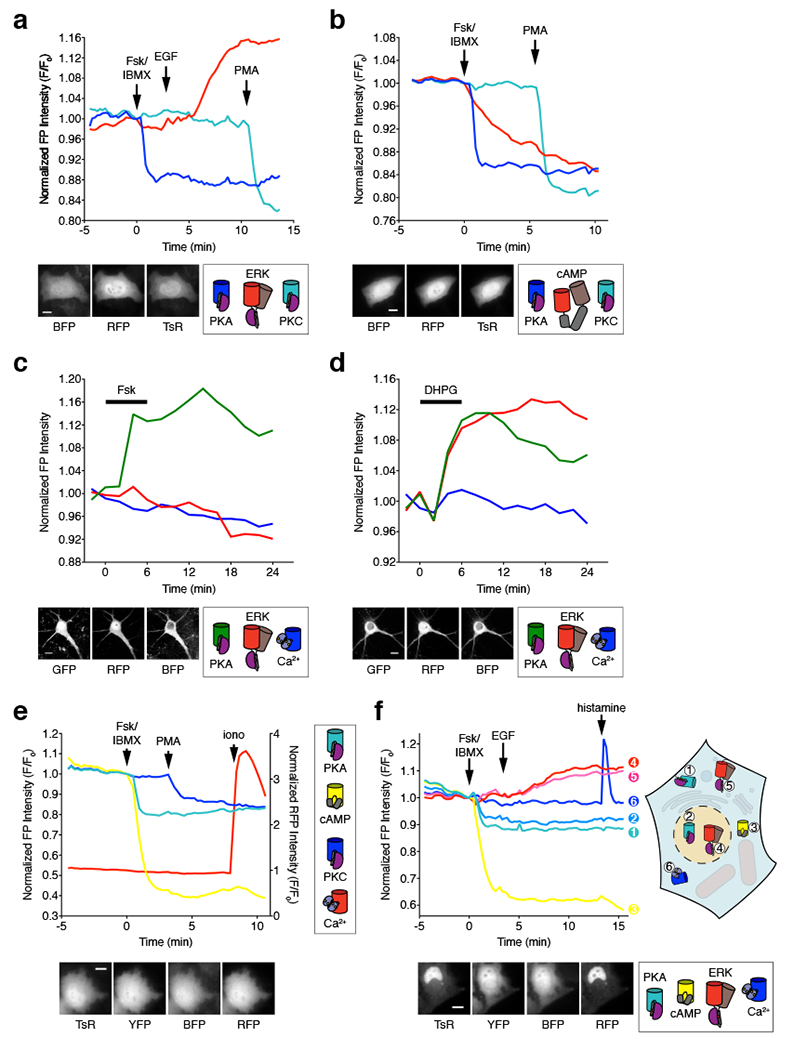
Figure 7. Multiplexed activity imaging using single-fluorophore biosensors.

(a, b) Three-parameter time-lapse epifluorescence imaging in HeLa cells. (a) Time-course of blueAKAR (blue), RAB-EKARev (red), and sapphireCKAR (teal) responses in a single cell treated with 50 μM Fsk and 100 μM IBMX (Fsk/IBMX), 100 ng/mL EGF, and 100 ng/mL PMA. Data are representative of n=13 cells from 5 independent experiments. Representative images of each channel are shown below. (b) Time-course of blueAKAR (blue), RAB-ICUE (red), and sapphireCKAR (teal) responses in a single cell treated with Fsk/IBMX and PMA. Data are representative of n=17 cells from 3 independent experiments. Representative images of each channel are shown below. (c, d) Three-parameter time-lapse confocal imaging in cultured rat cortical neurons. (c) Time-course of ExRai-AKAR (green; 488 nm excitation), RAB-EKARev (magenta) and BCaMP (blue) responses in the cell soma following Fsk stimulation. Data are representative of n=68 neurons from 6 independent experiments. (d) Time-course of ExRai-AKAR (green; 488 nm excitation), RAB-EKARev (magenta) and BCaMP (blue) responses in the cell soma of a single cultured neuron following DHPG stimulation. Data are representative of n=104 neurons from 10 independent experiments. (e, f) Higher-order multiplexed imaging in HeLa cells. (e) Four-parameter imaging time-course of sapphireAKAR (teal), Flamindo2 (yellow), and blueCKAR (blue), and RCaMP (red) responses in a single cell treated with Fsk/IBMX, PMA, and 1 μM ionomycin (iono). Data are representative of n=15 cells from 8 independent experiments. Representative images of each channel are shown below. (f) Six-parameter imaging time-course in a single cell co-expressing 1) Lyn-sapphireAKAR (teal), 2) sapphireAKAR-NLS (light blue), 3) Flamindo2 (yellow), 4) RAB-EKARev-NLS (red), 5) Lyn-RAB-EKARev (pink), and 6) B-GECO1 (blue) and treated with Fsk/IBMX, EGF, and 100 μM histamine. Data are representative of n=46 cells from 10 independent experiments. Representative images of each channel are shown below. Scale bars, 10 μm. Curves are normalized with respect to time 0 (F/F0; a, b, e, and f) or with respect to the average intensity of the baseline (c, d). Additional curves are shown in Supplementary Fig. 5–7.
