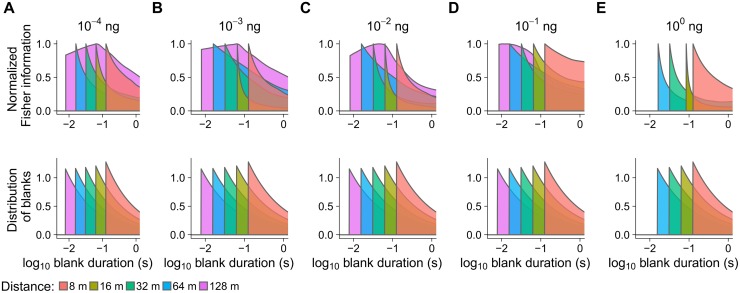
Fig 4. ORN coding precision of pheromone encounters is adjusted to the statistics of blanks in the plume.
(Top row) Profiles of the coding accuracy (Fisher information) as a function of blank duration. The situation is shown for different pheromone doses (A–E) and virtual downwind distances from the source (color). Each Fisher information curve was individually scaled (normalized) to achieve that its maximum value is equal to 1. Stimulation by 100 ng pheromone dose was not performed for 128 m. (Bottom row) The distributions of blanks for the corresponding distances. With the exception of the largest distance (128 m), the Fisher information profiles follow the distribution profiles, which means that the coding resources are distributed in agreement with the frequency of various blank durations. In particular, the maximal coding accuracy, indicated by the location of the maximum Fisher information, tends to occur at the mode of the corresponding distribution, cf. Fig 5. The adjustment results in an average coding accuracy optimized for the particular distance (Fig 6).

