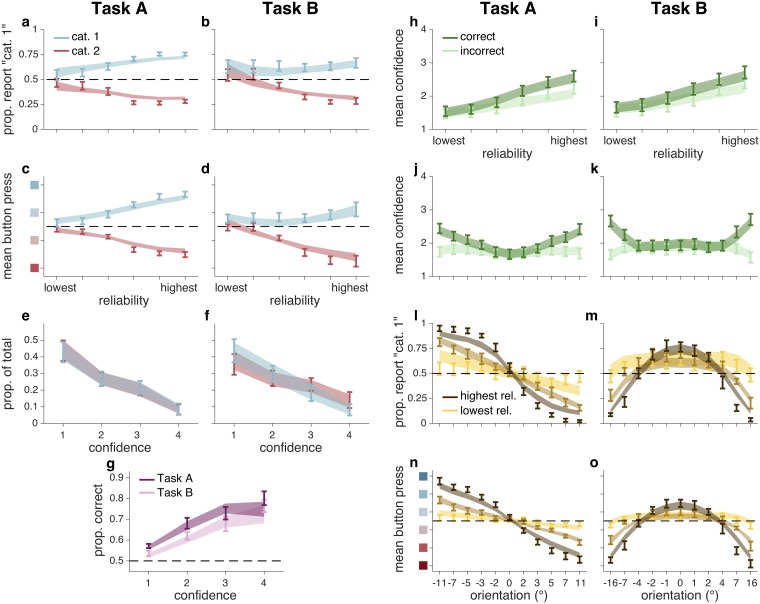
Fig 3. Behavioral data and fits from best model (Quad), experiment 1.
Error bars represent ±1 s.e.m. across 11 subjects. Shaded regions represent ±1 s.e.m. on model fits. (a,b) Proportion “category 1” reports as a function of stimulus reliability and true category. (c,d) Mean button press as a function of stimulus reliability and true category. (e,f) Normalized histogram of confidence reports for both true categories. (g) Proportion correct category reports as a function of confidence report and task. (h,i) Mean confidence as a function of stimulus reliability and correctness. (j,k) Mean confidence as a function of stimulus orientation and reliability. (l,m) Proportion “category 1” reports as a function of stimulus orientation and reliability. (n,o) Mean button press as a function of stimulus orientation and reliability. (c,d,n,o) Vertical axis label colors correspond to button presses, as in Fig 1a. (l–o) For clarity, only 3 of 6 reliability levels are shown, although models were fit to all reliability levels.

