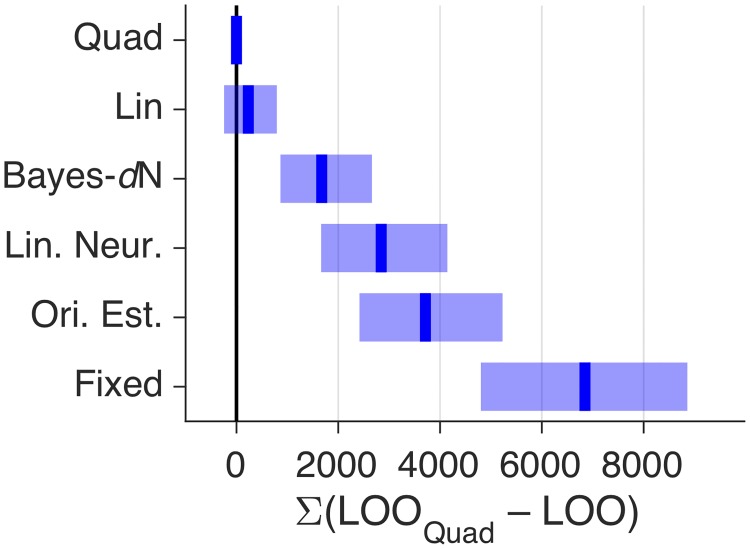
Fig 6. Comparison of core models, experiment 1.
Models were fit jointly to Task A and B category and confidence responses. Blue lines and shaded regions represent, respectively, medians and 95% CI of bootstrapped summed LOO differences across subjects. LOO differences for these and other models are shown in S1a Fig.

