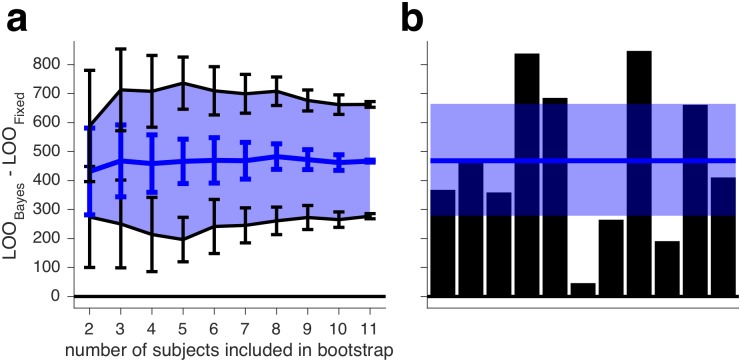
Fig 11. Example analysis of a bootstrapped confidence interval.
(a) Uncertainty estimates for bootstrapped confidence intervals, as a function of the number of subjects included. Blue line represents the median bootstrapped mean of LOO differences, and black lines indicate the lower and upper bounds of the 95% CI. Error bars represent ±1 s.d. (b) For comparison to a, the standard style of plot used to show model comparison results (e.g., Fig 4).

