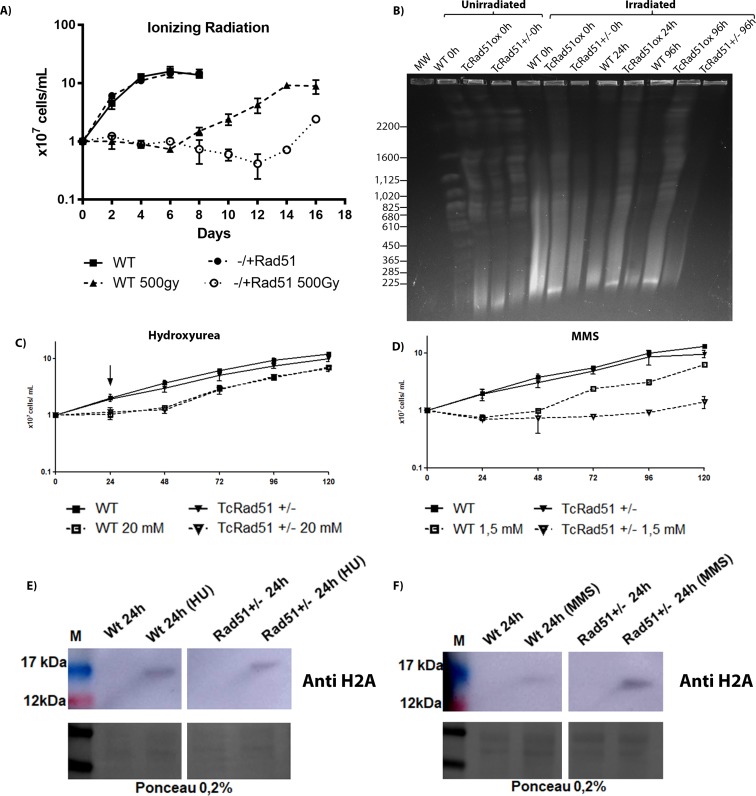
Fig 2. Growth of T. cruzi following DNA damage treatment.
A) The sensitivity of WT and TcRAD51-/+ cells to gamma radiation was determined. Parasites were exposed to 0 Gy or 500 Gy of gamma irradiation, the number of parasites was determined every two days for 28 d. Values represent the mean of triplicates and error bars indicate standard deviations. B) Chromosomal profile from different T. cruzi (WT, TcRAD51ox, and TcRAD51+/-) samples after treatment with gamma radiation (500 Gy). Chromosomal bands from different T. cruzi samples were separated by PFGE and stained using ethidium bromide. Whole chromosomes from Saccharomyces cerevisiae were used as molecular weight markers. (C) T. cruzi growth curve after treatment with 20 mM HU. Arrow indicates the point when the drug was removed. (D) T. cruzi growth curve after treatment with 1.5 mM MMS. The number of cells was determined every 24 h by vital staining. Curves shown are an example of three independent experiments that were performed in triplicate. Error bars represent standard deviations. (E) Detection of H2A levels in epimastigotes treated with 20 mM HU. Cell lysates were separated by SDS-PAGE, and proteins were detected by Western blot using anti-H2A (1:3,000) antiserum and peroxidase-conjugated anti-IgG secondary (1:10,000 or 1:12,000). Loading control is depicted in the bottom panel (Ponceau 0.2%). (F) Detection of H2A levels in epimastigotes treated with 1.5 mM MMS. Cell lysates were separated by SDS-PAGE, and proteins were detected by Western blot with anti-H2A (1:3,000) antiserum and peroxidase-conjugated anti-IgG secondary (1:10,000 or 1:12,000). Loading control is depicted in the bottom panel (Ponceau 0.2%).

