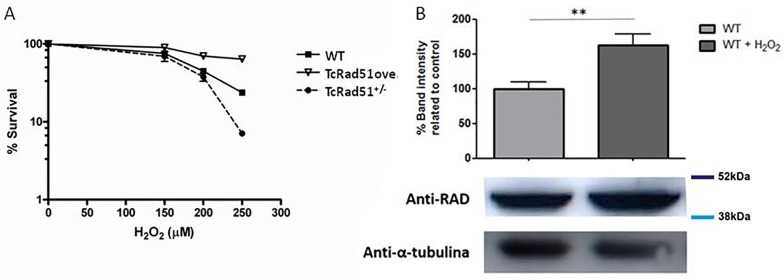
Fig 5. T. cruzi response to oxidative stress.
(A) The sensitivity of WT, TcRAD51ox, and TcRAD51+/- cells against 150, 200 and 250 μM H2O2. Parasites were counted 48 h after treatment. Numbers are represented as a percentage of untreated cells. Values represent the mean of triplicates. Error bars indicate standard deviations. (B) Bar chart representing the detection of TcRad51 protein levels in epimastigotes extracts from WT cultures after treatment with 200 μM of H2O2 (performed in triplicate). Cell lysates were separated by SDS–PAGE and proteins were detected by Western blot with anti-TcRad51 (1:2,000) antiserum and peroxidase-conjugated anti-IgG secondary (1:10,000 or 1:12,000). A control showing tubulin levels was detected using mouse anti-Tubulin (1: 12,000) antiserum. Statistical analysis was performed using Student’s t-test. ** p < 0.01.

