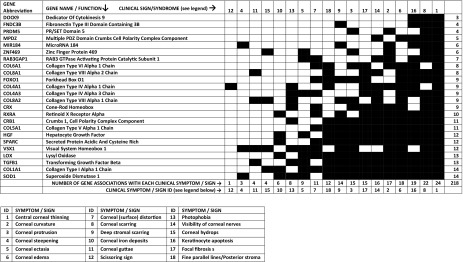
Table 1.
Correlation matrix between specific genes implicated in keratoconus and clinical symptoms/signs
Symptoms/signs are represented according to the number of genes they correspond to, in an ascending order from top to bottom. The correspondence between symptoms/signs and their ID in this table is presented in the columns to the left of this legent

