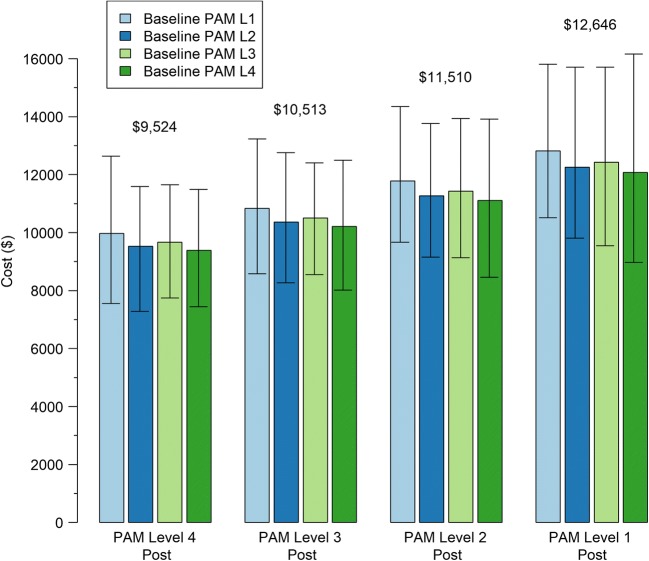
Fig. 1.
Predicted costs based on baseline PAM level and post PAM level. Controlling for baseline costs, sex, age income, and baseline risk score. Numerical values above each set of 4 bars are the weighted average of the values of those bars, weighted by the relative prevalence of the combinations of baseline PAM, and follow-up PAM in the cohort. Estimates are highly correlated so the widths of the bootstrap confidence intervals do not reflect relative differences.

