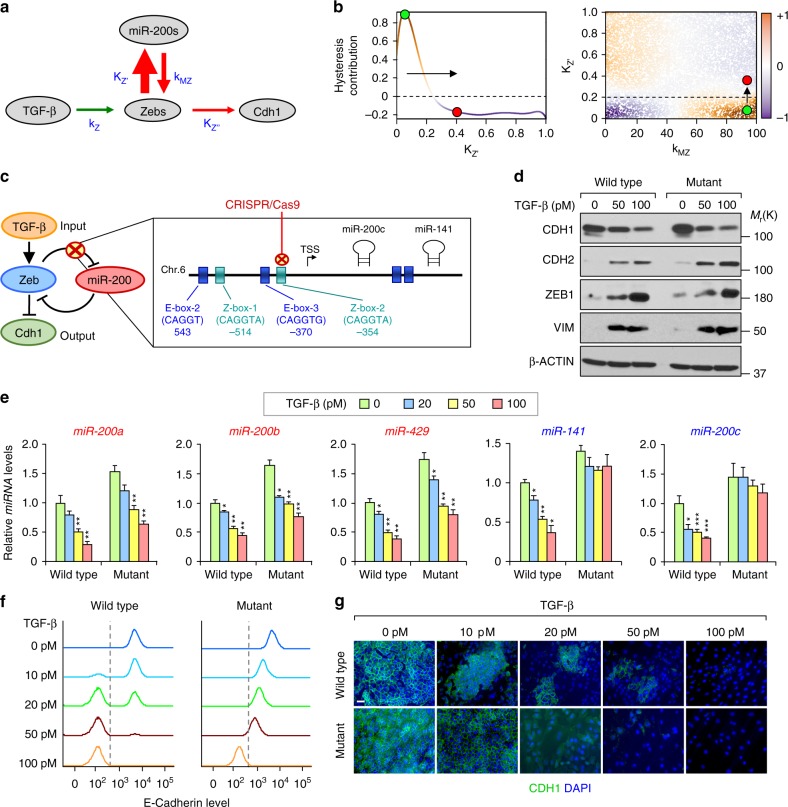
Fig. 2.
ZEB1 repression of miR-200s tightly controls hysteresis during EMT. a Schematic illustration of the strength of interaction constants and reaction coefficients: kZ, KZ′, KZ′′ and kMZ. The thickness of the arrows represents the magnitude of the interaction strength (sensitivity index). b High dimensional model representation (HDMR) component functions of hysteresis contribution in KZ′ (left panel; first-order) and KZ′ vs kMZ (right panel; second-order). The green dot denotes a region with hysteresis (orange background) and red dot a region without hysteresis (blue background). The arrow represents a minimal modification of the KZ′ that eliminates hysteresis. c Representation of the Z-box-2 deleted using CRISPR-Cas9 in NMuMG and EpRAS cells generating the corresponding mutant cells. d Western-blot analysis of EMT markers in wild type and mutant NMuMG clonal cells at the indicated concentration of TGF-β for 72 h. e qRT-PCR analysis of the expression levels of, cluster-1 (red) and cluster-2 (blue) miR-200s family members in wild type and mutant NMuMG cells (n = 3 biological replicates) treated with the indicated concentrations of TGF-β for 72 h. f Flow cytometry analysis and g immunofluorescence analysis of CDH1 expression in NMuMG clones after treatment with indicated concentrations of TGF-β for 72 h. Scale bar: 20 μm

