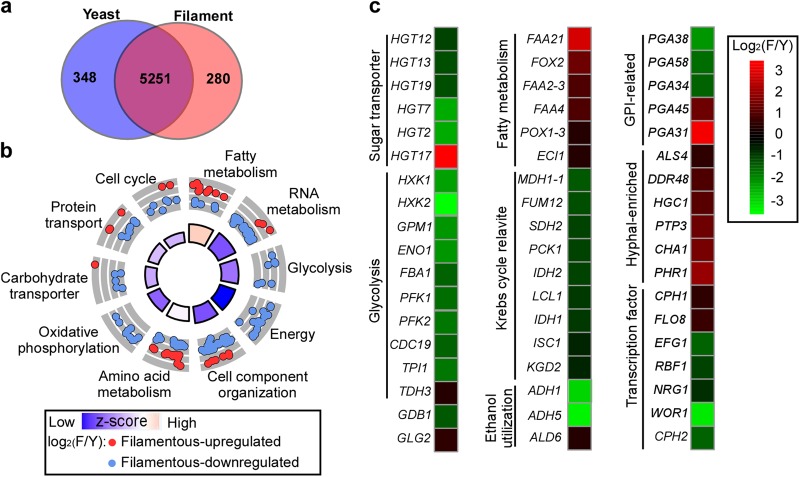
Fig. 5. Comparison of global gene expression profiles of C. auris in typical yeast and filamentous cells.
a Venn diagram depicting differentially expressed genes. A twofold difference cut off and false discovery rates (FDRs) less than 0.05 were used to define differentially expressed genes. b GO enrichment analysis of differentially expressed genes was conducted. Red or blue circles represent upregulated or downregulated genes in filamentous cells, respectively. The inner cycle bars represent statistical significance. c R package heatmap was used to depict selected differentially expressed genes. Functional categories of genes are indicated. Log2(F/Y), Log2 (read counts of filamentous cells/read counts of yeast cells)

