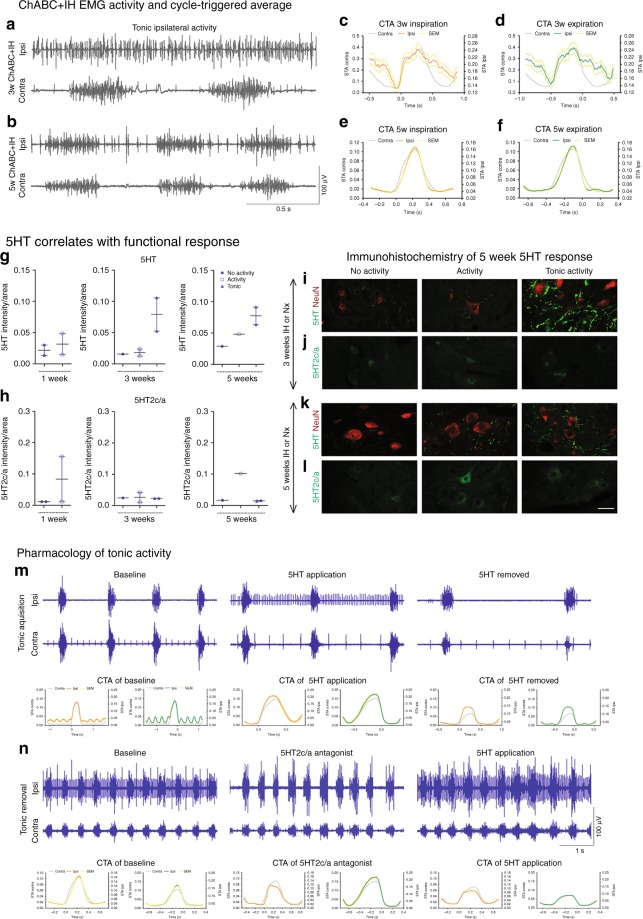
Fig. 4.
Excessive 5HT and receptor imbalance causes ipsilateral tonic activity. a–f Tonic diaEMG activity following a 3 or b 5 weeks conditioning. c–f Representative CTAs of ipsilateral (coloured) and contralateral (grey) activity for mean inspiration (orange) and expiration (green) where ±SEM is shown for both inspiration (yellow) and expiration (light green). IH for c, d 3 or e, f 5 weeks (n = 6, see Fig. 5). g–l Intensity readings for g 5HT, h 5HT2c/a and l representative images at the ipsilateral C4 PMP utilizing i+k NeuN (red) and 5HT (green) or j+l 5HT2c/a (green). Graphs show mean ± SEM. Data grouped on ipsilateral hemidiaphragm activity: non-responders (circle; n = 1/2), normal activity (square; n = 1/2), tonic (triangle; n = 2). m, n Tonic activity following m 5HT (n = 7) and n 5HT2c/a antagonist (n = 6) application. CTAs of ipsilateral (coloured) and contralateral (grey) activity for mean inspiration (orange) and expiration (green) where ±SEM is shown for both inspiration (yellow) and expiration (light green) of pharmacologically induced and removed tonic activity. Panels recorded in the same animal. For all EMG or graph panels: animals were treated with ChABC+IH (blue)

