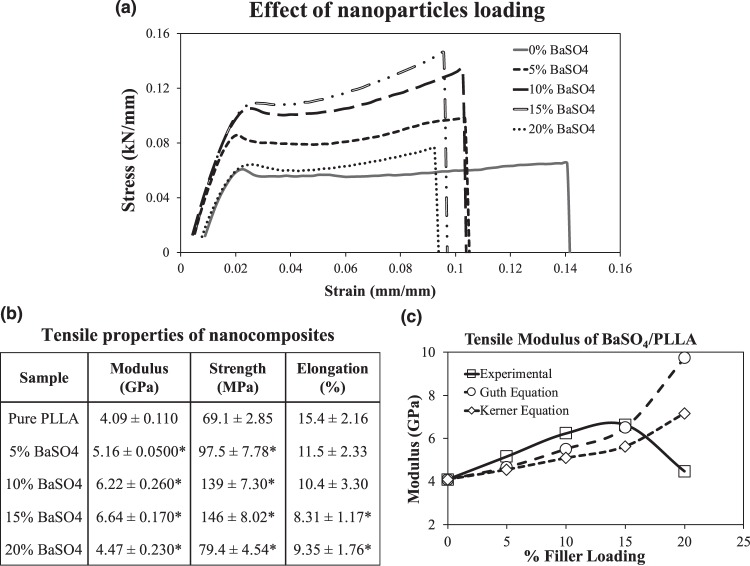
Figure 1.
Tensile properties of nanocomposite BaSO4/PLLA fibers with different filler loadings (0–20%). (a) Representative stress-strain curve of the different nanocomposite samples. (b) Mean tensile modulus, strength and elongation at break of the nanocomposites are represented as mean value ± standard deviation. (n = 10) * indicates a statistically different value of the composite compared to the standard PLLA based on one-way ANOVA (p < 0.05). (c) The predicted tensile modulus of BaSO4/PLLA nanocomposite as a function of filler loading according to Guth’s equation and Kerner’s equation40,42.

