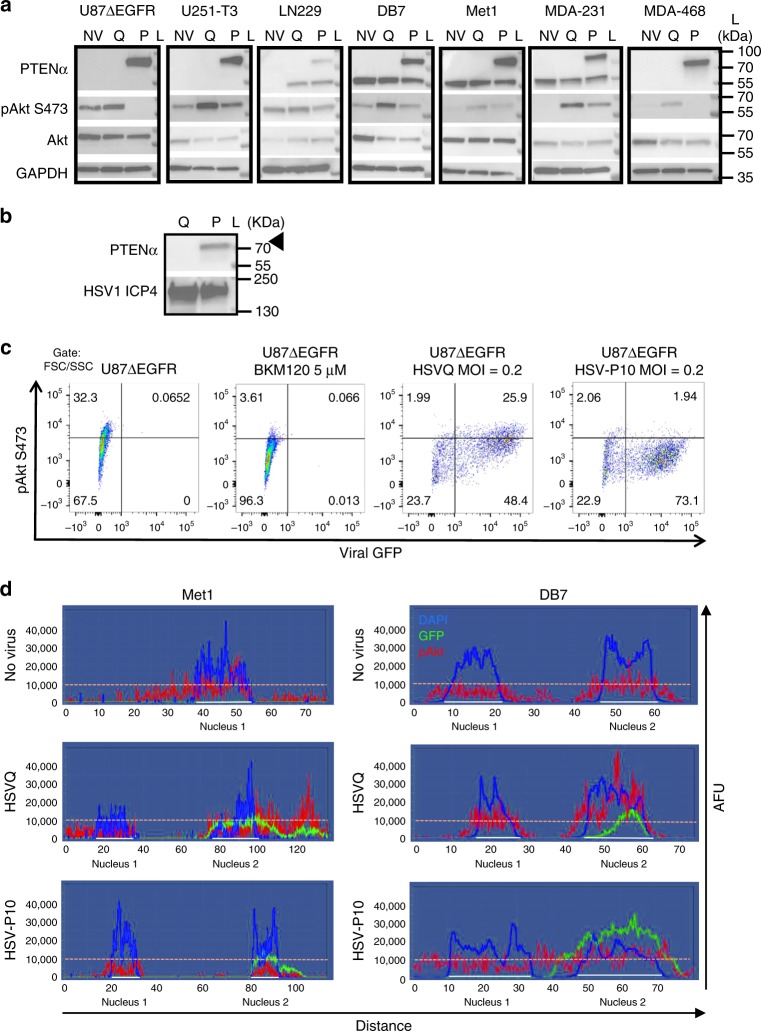
Fig. 2.
HSV-P10 AKT inhibition. a Western blots of lysates from the indicated cells infected with HSVQ (Q) or HSV-P10 (P) or left untreated (NV). Infected cells (MOI = 1) were lysed 24 hpi and probed for expression of PTENα, pAKT (S473), Akt, and GAPDH. L indicates the moleculcar weight ladder. b Western blot for secreted PTEN expression in conditioned medium. Culture media was concentrated 20X from U87∆EGFR cells infected 24 h with either HSVQ (Q) or HSV-P10 (P10) and probed for secreted PTENα. L indicates the molecular weight ladder. c Flow cytometric analysis of pAkt-S473 and virus encoded GFP in infected U87∆EGFR cells 15 hpi. d Spectral analysis of fluorescent intensity along a random line drawn across the view field of one or two cells visualizing pAKT (red), DAPI (blue) and GFP (green) of the indicated cells. y-axis represents arbitrary fluorescence units (AFU). Note the higher intensity of pAKT in HSVQ-infected (GFP positive) cells relative to adjacent uninfected (GFP negative) cell (middle panel). Note the lack of increased pAKT intensity in HSV-P10 infected (GFP positive) cells relative to adjacent uninfected (GFP negative) cells (bottom panel)

