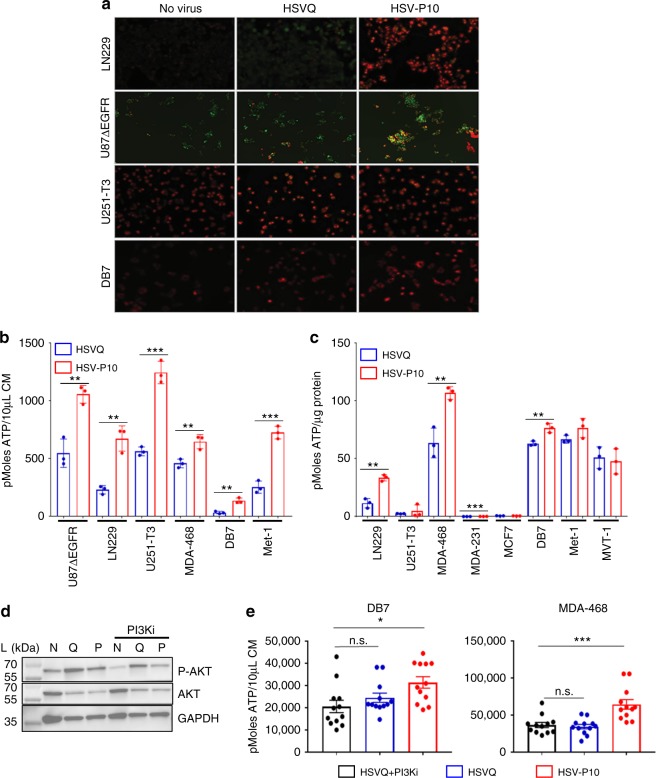
Fig. 3.
Effects of PTENα on HSV-P10 infected cells. a Increased mitochondrial membrane potential in HSV-P10 infected cells 6 hpi. Seeded cells were infected with either HSVQ or HSV-P10 at MOI = 0.5 for 6 h, and mitochondrial membrane potential indicated by JC-1 red fluorescence was imaged using fluorescence microscopy. Scale bar = 100 µm. b ATP release from infected cells 24 hpi. Data shown are mean ATP concentration in conditioned media from infected cells 24 hpi ± S.D. Statistical analysis performed with a 2-tailed Student’s T-test. (n = 3/group, **p < 0.01, ***p < 0.001). c ATP measured in cell lysates of infected cells 24 hpi. Data shown are mean ATP concentration 24 hpi ± S.D. Statistical analysis performed with a 2-tailed Student’s T-test. (n = 3/group, **p < 0.01, ***p < 0.001). d Western blot of DB7 cells 24 hpi with HSVQ (Q), HSV-P10 (P), or left untreated (NV) ± PI3Ki (LY294002). L indicates the molecular weight ladder. e ATP release from DB7 or MDA-468 cells 12 hpi with HSVQ or HSV-P10. HSVQ and PI3Ki treated samples were also evaluated for ATP release. Data shown are mean ATP concentrations in conditioned media from infected cells ± SEM. Statistical analysis performed with a 2-tailed Student’s T-test (n = 6/group, *p < 0.05, ***p < 0.001, n.s. = not significant)

