Fig. 4.
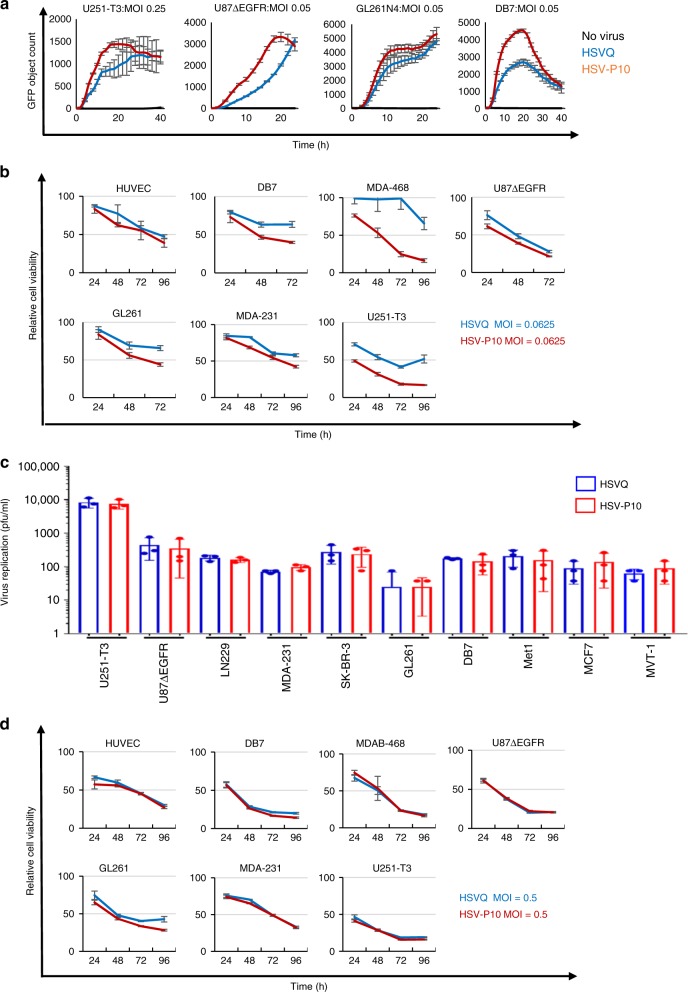
Kinetics of HSV-P10. a Comparison of HSVQ and HSV-P10 virus replication in the indicated cells. Seeded tumor cells were infected at the designated MOIs and GFP expression was monitored for 24–48 h utilizing the Cytation 5 Cell Imaging Multi-Mode Reader in conjunction with a BioSpa 8 Automated Incubator (BioTek Instruments, INC.). GFP object count was quantified and graphed as an average of 4 wells per treatment group ± SEM. Black line: no virus, blue line: HSVQ, red line: HSV-P10. b Cytolytic activity of HSVQ (blue line) vs. HSV-P10 (red line) at a low MOI. Cell viability of HSVQ or HSV-P10 infected tumor cell lines at MOI = 0.0625 for all cells at the indicated time points after infection as measured by MTT. Data shown are percentage of viable cells relative to uninfected controls ± S.D. (n = 6). c Comparison of HSVQ and HSV-P10 viral yield (burst size). Data shown are median titers from cultures ± S.D. (n = 3/group). d Cytolytic activity of HSVQ (blue line) vs. HSV-P10 (red line) at high MOI. Cell viability of HSVQ or HSV-P10 infected tumor cell lines at MOI = 0.5 for all cells at the indicated time points after infection as measured by MTT. Data shown are percentage of viable cells relative to uninfected controls ± S.D. (n = 6)

