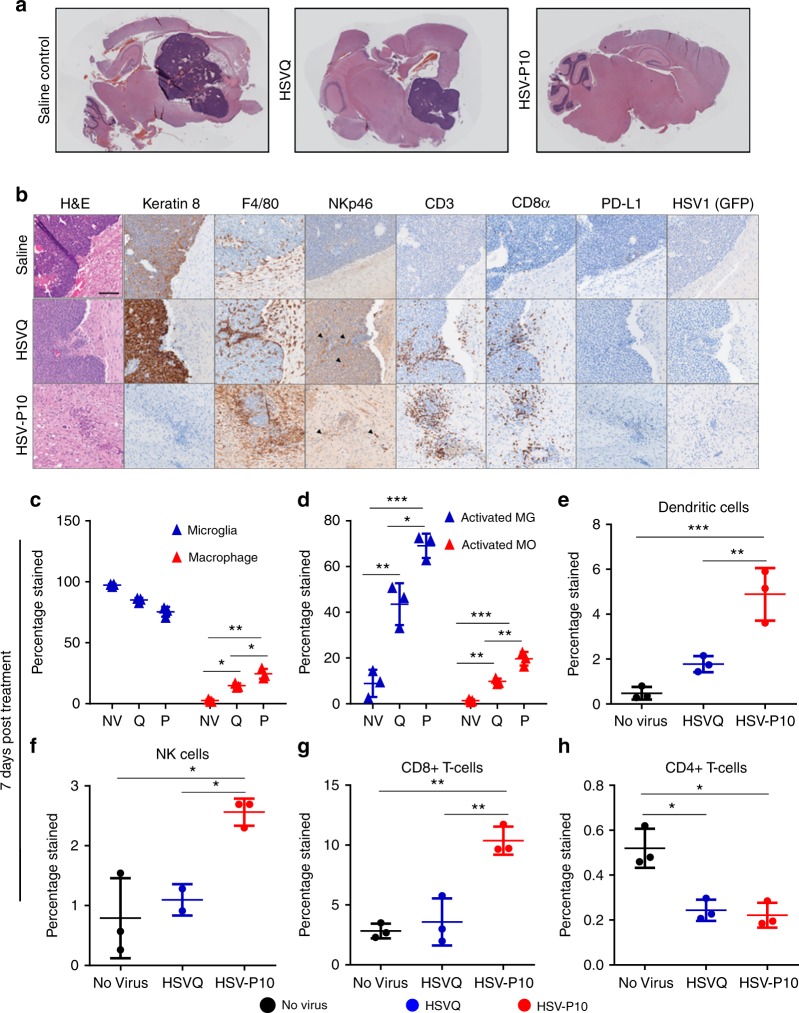
Fig. 8.
HSV-P10 induces enhanced immune cell influx towards infected tumors. Tumor-bearing FVB/N mice were treated with 1e5 pfu of HSVQ, HSV-P10, or saline control 8 days post tumor implantation. a Stitched 4X bright field images of H&E stained sagittal sections of mouse brains 3 days post virus injection. b Representative 20X bright field images of H&E, Keratin 8, F4/80, NKp46, CD3, CD8α, PD-L1, and HSV1 (GFP) from sagittal sections of mouse brains 3 days post virus injection. Scale = 0.1 mm. c Ratio of macrophages (CD11b + F4/80 + CD45bright) to microglia (CD11b + F4/80 + CD45dim). d Percentage of cells in c positive for MHC-II. e Dendritic cell (CD11c + CD80 + MHC-II + ) infiltration. f NK cell (CD49b + NKp46 + ) infiltration. g CD8 + T-cell (CD3 + CD4 + ) infiltration. h CD4 + T-cell (CD3 + CD8 + ) infiltration. Data shown are averages ± s.d (n = 3/group) Statistical significance was assessed by one-way ANAOVA (n = 3, *p < 0.05, ***p < 0.001, ****p < 0.0001). Gating strategies for (c–h) are decribed in supplementary figure 6

