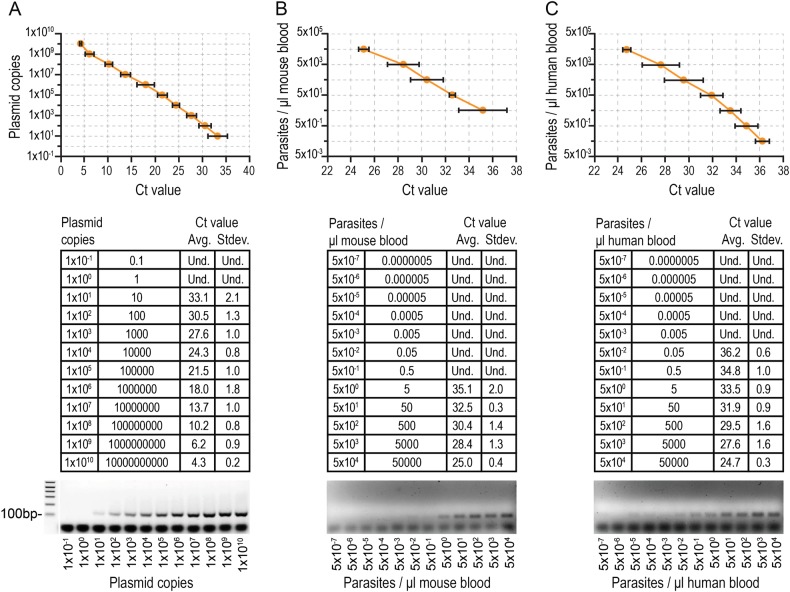
Fig. 3.
PbVac parasite detection and quantification by high-sensitivity qRT-PCR. Standard curves (top), Ct values (middle), and gel electrophoresis analysis (bottom) following qRT-PCR amplification of a 134 bp fragment of the PbVac 18S ribosomal gene in serial dilutions of a plasmid containing that fragment (a), of the PbVac parasite in mouse blood (b), and of the PbVac parasite in human blood (c). Dots indicate the average CT value and bars indicate the standard deviation obtained for at least three biological replicates

