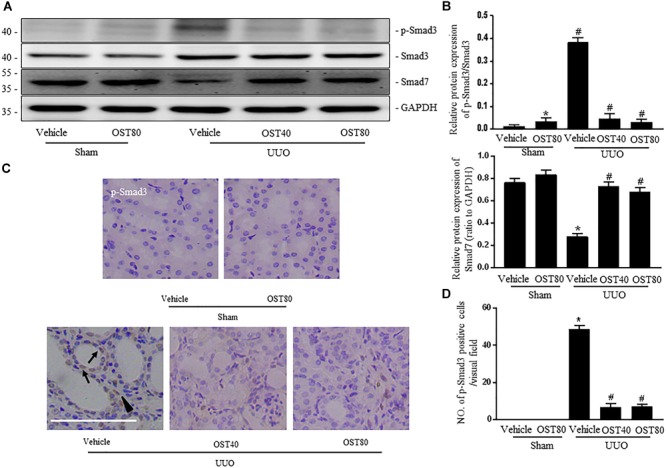
FIGURE 6.

OST regulates TGF-β1/Smad signaling in obstructive kidneys of UUO mice. Representative bands (A) and Western blots analyses (B) of p-Smad3, Smad3, Smad7 in the obstructed kidneys at 1 week after UUO. (C) Representative micrographs of the immunostaining for p-smad3 in the kidneys from indicated group. Arrows indicate immunostaining positive tubular epithelial cells and arrowhead show immunostaining positive interstitial cells. Scale bar = 100 μm. (D) Quantification of the number of p-Smad3 positive cells per visual field on kidneys from the indicated groups. Data are expressed as mean ± SEM. ∗P < 0.05 versus Sham + Vehicle; #P < 0.05 versus UUO + Vehicle.
