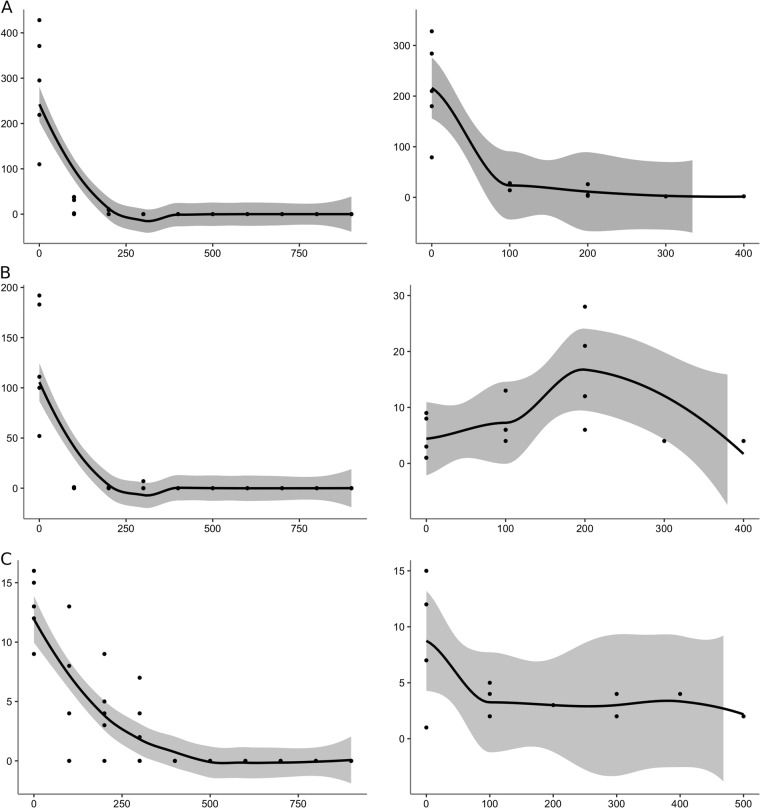
Fig. 1.
Charts in ggplot with LOESS smoothing showing the total number of eggs (left panels) and Ae. albopictus females (right panels) on the y-axis as a function of the distance (in meters) from the forest edge (x-axis) at the (a) Adolpho Ducke, (b) Pedra Branca, and (c) Morro dos Macacos sampling sites. The shaded area represents the 95% confidence interval of the mean value (solid line). Statistical details are provided in Table S4

