
Fig. 3.
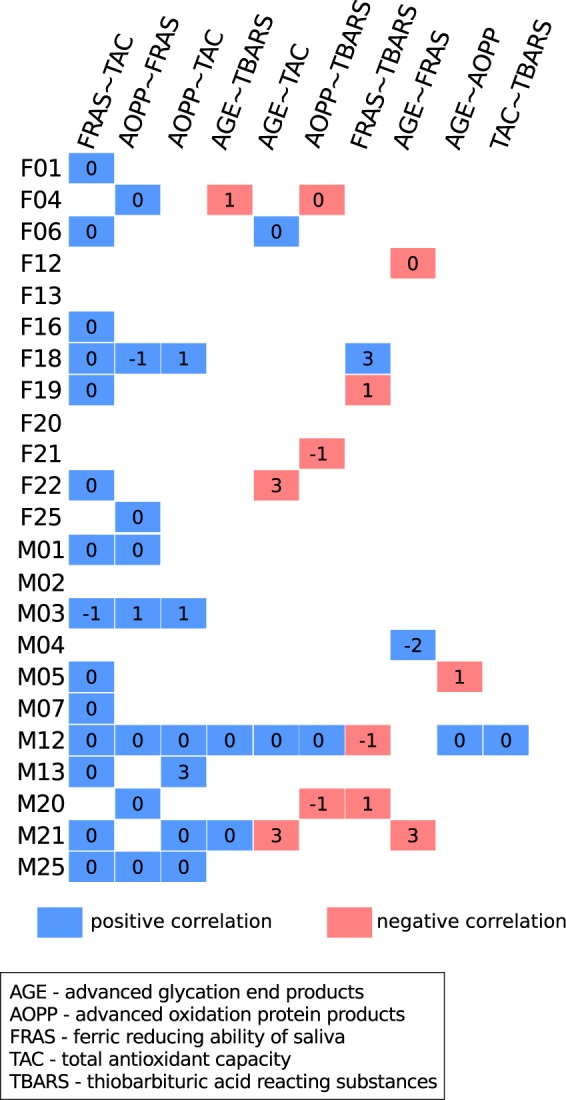
Correlations between the oxidative stress markers. The summary of the Pearson’s intra-individual correlations. The color of square indicates either a positive or a negative correlation (blue or red) of a pair of oxidative stress markers in a volunteer. The number in square indicates the days by which the correlation was lagged. Empty white squares indicate no significant correlation. The majority of volunteers possessed a positive correlation between FRAS and TAC. Several marker pairs had positive correlations in some volunteers while negative correlations in others