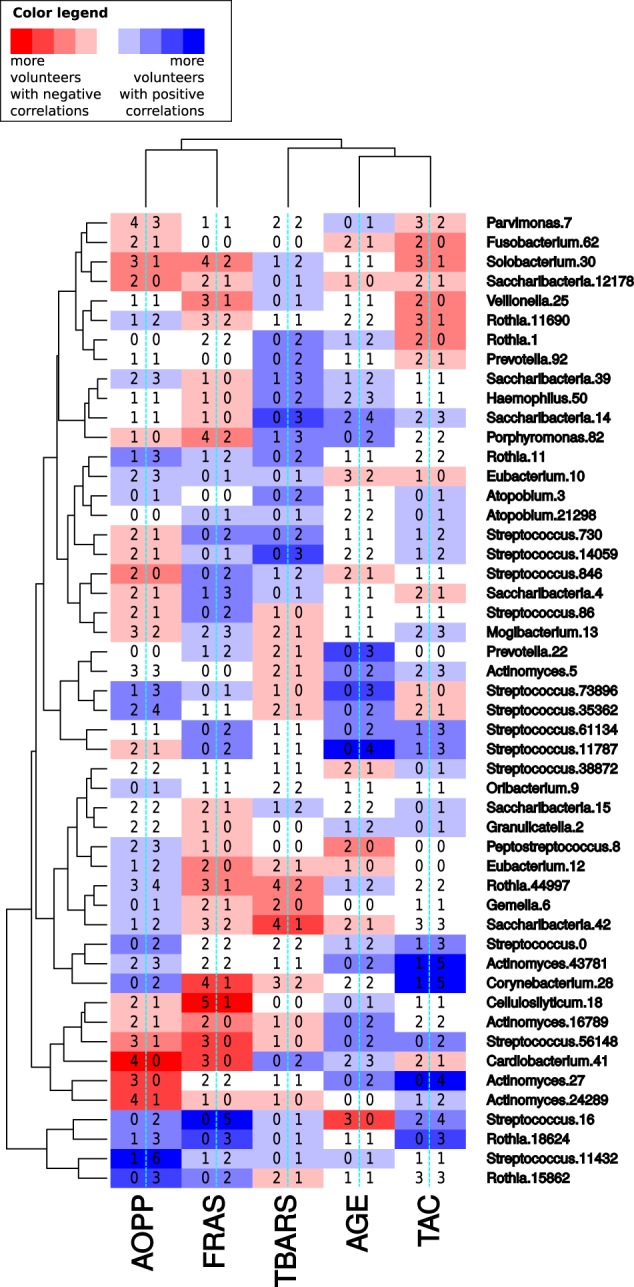
Fig. 4.

Marker-OTU correlations on intra-individual level. The summary of the Pearson’s correlation plot in the Supplementary Figure S7. The graduated color in tones from blue to white to red indicate whether the correlations found in the volunteers on intra-individual levels were mostly positive or negative. The number on the left in each rectangle indicates the number of volunteers with a negative correlation, while the number on the right in each rectangle indicates the number of volunteers with a positive correlation. The oxidative stress markers and the OTUs have been ordered according to their correlation tendency by hierarchical clustering using Euclidean distances. The OTUs with the strongest tendency of either positive or negative correlations with some of the oxidative stress markers were e.g. Streptococcus-OTU16 (Streptococcus mutans), Actinomyces-OTU27 and Cardiobacterium-OTU41
