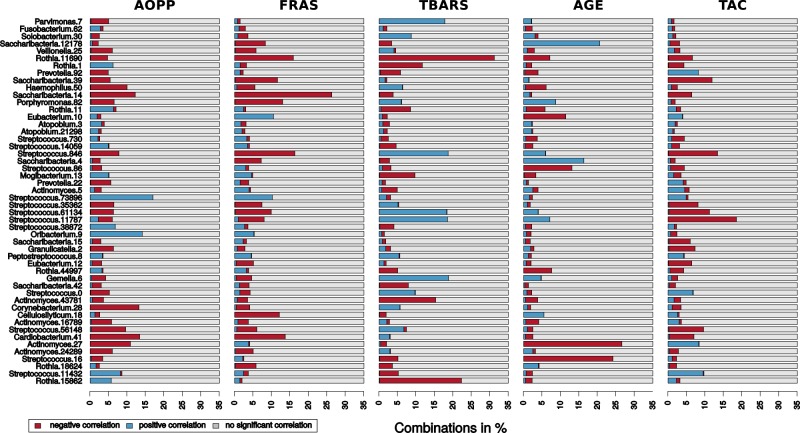
Fig. 5.
Marker-OTU correlations obtained by the simulation of collection of only one sample per volunteer. The bar-plots illustrate which portion (in %) of the 1000 combinations in the one-sample-one-volunteer approach simulation resulted in a positive correlation (blue), in a negative correlation (red) or no significant correlation (p > 0.05, grey). Both positive and negative correlations occurred in the majority of the marker-OTU pairs in low proportion. However, there were also some marker-OTU pairs with an explicitly positive or an explicitly negative correlation (no contradictory correlations were detected). The bacterial OTUs in this figure are arranged according to the Fig. 4, to make them easily comparable

