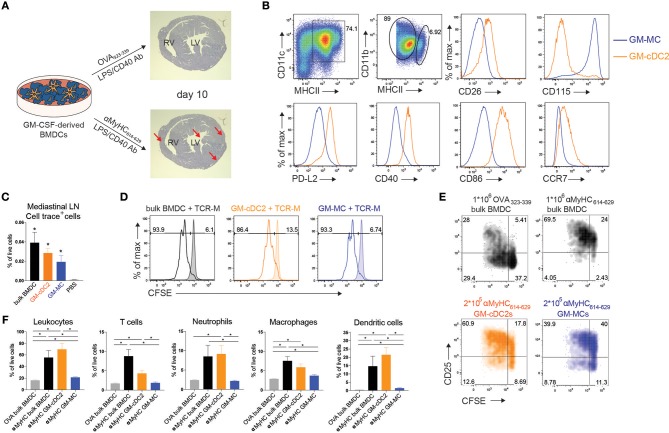
Figure 1.
Transfer of bone marrow cDC2 initiates EAM. (A) Schematic overview of BMDC-induced mouse model of experimental autoimmune myocarditis (EAM). GM-CSF derived BMDCs were matured using LPS and αCD40 and loaded with heart specific self-antigen αMyHC614−629 or the harmless OVA323−339 antigen. αMyHC614−629 BMDC immunization leads to fulminant myocarditis (bottom, red arrows) as shown by heamatoxylin and eosin staining of heart sections at day 10 post-immunization, whereas OVA BMDC immunization does not (top). RV, Right Ventricle; LV, Left Ventricle. (B) Flow cytometric analysis of GM-CSF derived BMDCs harvested at day 10 of culture. Histograms display expression of the specified markers by MHCIIint GM-MCs and MHCIIhi GM-cDC2s. (C) Cell trace+ cell percentages of total living cells in mLN of i.p. injected mice with 0.5 × 10⁶ cell trace-labeled BMDCs, GM-cDC2s, GM-MCs, or PBS 12 h before sacrifice. (D) Histograms representing CFSE dilution of TCR-M cells co-cultured with bulk BMDCs, sorted GM-cDC2s, or sorted GM-MCs with or without 15 μg/ml αMyHC614−629 (respectively, non-filled and filled histograms) in a 1/5 DC/TCR-M ratio. (E) 4 days after naïve TCR-M injection and 3 days after OVA-loaded BMDC, αMyHC-loaded BMDC, GM-cDC2, or GM-MC injection, mediastinal LN was isolated. CFSE dilution and CD25 expression of donor TCR-M cells was analyzed by flow cytometry. (F) Leukocyte, T cell, neutrophil, macrophage and DC percentages of total living cells in the heart of OVA BMDCs, αMyHC BMDC, αMyHC GM-cDC2, and αMyHC GM-MC injected mice at day 10 post-injection. All bar graphs in this figure shows data as the mean ± SEM; *P ≤ 0.05.

