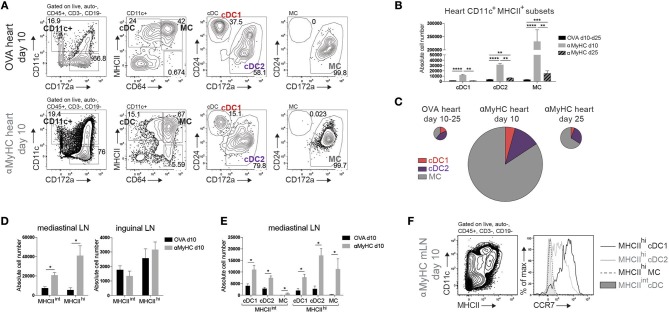
Figure 2.
DC subsets accumulate in heart and mLN during EAM. (A) Representative flow cytometry gating strategy for cDCs, CD11c+ MCs, cDC1s, and cDC2s in the heart of OVA or αMyHC BMDC injected WT mice on day 10 post-injection. Numbers specify cell percentage inside nearby gates. (B) Absolute cell numbers of cDC1s, cDC2s, and MCs in the heart of OVA (pooled data of day 10 and day 25 post-inj.) and αMyHC BMDC (at day 10 and day 25 post-inj.) injected WT mice as assessed by flow cytometry. (C) Pie charts depicting the distribution of APC subsets in heart of OVA (pooled data of day 10 and day 25 post-inj.) and αMyHC BMDC (at day 10 and day 25 post-inj.) injected WT mice. Pie chart sizes are proportional to total absolute cardiac APC numbers. (D,E) Absolute numbers of MHCIIint and MHCIIhi DCs (D) and MHCIIint and MHCIIhi subsets (E) in the heart-draining mediastinal LN (D,E) and skin-draining inguinal LN (D) of OVA and αMyHC BMDC injected WT mice at day 10 post-injection. (F) Illustrative flow cytometry gating strategy for MHCIIint and MHCIIhi CD11c+ cells and CCR7 expression of MHCIIhi cDC1s, MHCIIhi cDC2s, MHCIIhi MCs, and MHCIIint cDCs in mLN of αMyHC BMDC injected WT mice at day 10. All bar graphs in this figure shows data as the mean ± SEM; *P ≤ 0.05; **P ≤ 0.01; ***P ≤ 0.001; ****P ≤ 0.0001.

