Figure 3.
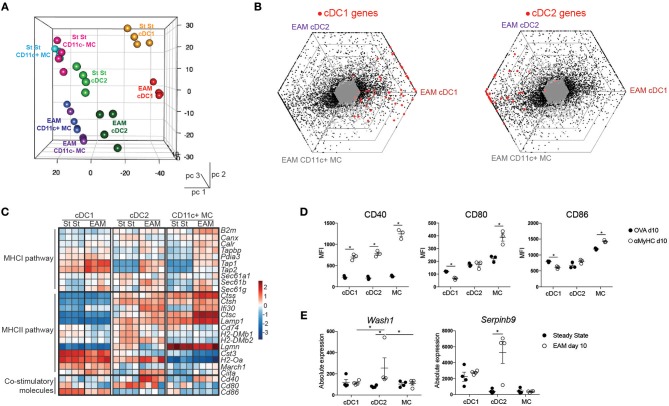
Expression profiling of cardiac APCs by RNA sequencing. (A) Front view of PCA of RNA-seq data from cDC1s, cDC2s, CD11c+ MC, and CD11c- MCs in the steady state (St St) and the inflamed (EAM d10) heart. PCA was calculated using the top 15% most varying genes between cell subsets. Each dot symbolizes one independently sorted replicate of the indicated cell population and four independent sorts were performed per subset. (B) Triwise diagrams of the gene expression at EAM day 10. Red dots represent cDC1 (left) and cDC2 hallmark genes (right). (C) Heatmap showing the relative expression of MHCI- or MHCII-associated genes normalized per mean expression of each gene in cardiac cDC1s, cDC2s, and CD11c+ MCs from steady state and EAM day 10 heart. (D) Mean Fluorescence Intensity of CD40, CD80, and CD86 expression on heart DC subsets in OVA and αMyHC BMDC injected WT mice at day 10 post-injection. (E) Graphs representing absolute expression of Wash1 and Serpbinb9, two cDC2-specific DEGs between steady state and EAM day 10 assessed by RNA-seq. All bar graphs in this figure show data as the mean ± SEM; *P ≤ 0.05.

