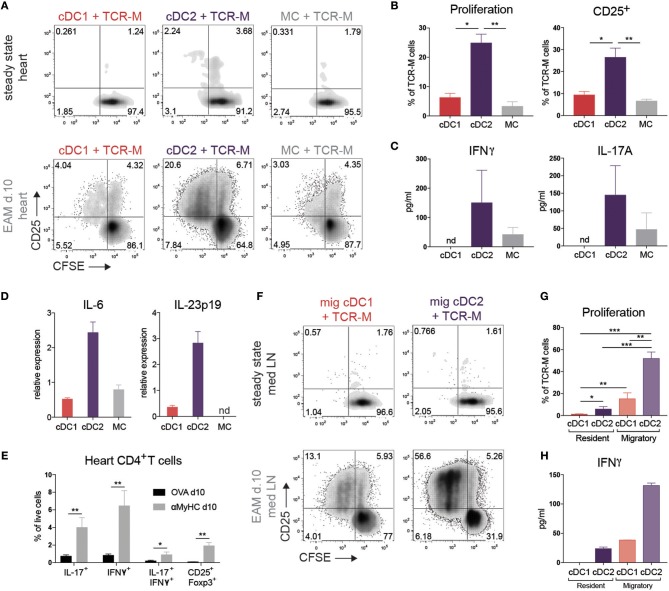
Figure 4.
cDC2s present self-antigen in heart and draining LN in EAM. (A) CFSE dilution and CD25 expression of TCR-M cells co-cultured for 3 days with sorted heart DC subsets at steady state and at EAM day 10. Hearts were pooled from 100 steady state mice and 6 mice suffering from acute EAM. Data are representative for three independent experiments. (B) Percentage of proliferation and CD25 expression of TCR-M cells from co-cultures plotted in panel A (mean ± SEM; *P ≤ 0.05; **P ≤ 0.01). (C) After 3 days of co-culture (plotted in A), IFNγ and IL-17A (pg/ml) was measured in cell supernatant by ELISA. ELISA was performed in duplo on the same sample (mean ± SD). (D) IL-6 and IL-23p19 mRNA expression in DC subsets sorted from at least 10 pooled hearts at EAM day 10 measured by qPCR. Relative mRNA expression was calculated by normalization to housekeeping genes and qPCR reactions were performed in triplicate (mean ± SD). (E) Percentages of heart-infiltrated IL-17+, IFNγ+, IL-17+/IFNγ+, and CD25+Foxp3+ CD4+ T cells of OVA (black bars) and αMyHC BMDC injected mice (gray bars) 10 days following BMDC injection measured by flow cytometry after PMA/ionomycin restimulation (mean ± SEM; *P ≤ 0.05; **P ≤ 0.01). (F) CFSE dilution and CD25 expression of TCR-M cells co-cultured for 3 days with sorted DC subsets of mLN at steady state and at EAM day 10. Data are representative for five independent experiments. (G) Percentage of proliferation of TCR-M cells from co-cultures plotted in (F) (mean ± SEM; *P ≤ 0.05; **P ≤ 0.01; ***P ≤ 0.001). (H) After 3 days of co-culture (plotted in F), IFNγ (pg/ml) was measured in cell supernatant by ELISA. ELISA was performed in duplo on the same sample (mean ± SD).

