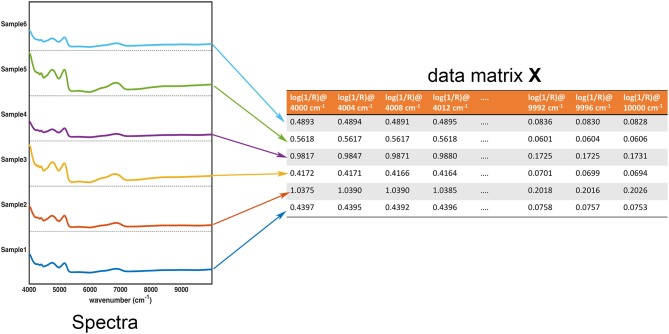
Figure 1.
Graphical illustration of the equivalence between the collected experimental data (in this case, NIR spectra for 6 samples) and the data matrix X. Each row of the data matrix corresponds to the spectrum of a sample, whereas each column contains the value of a specific variable over all the individuals.

