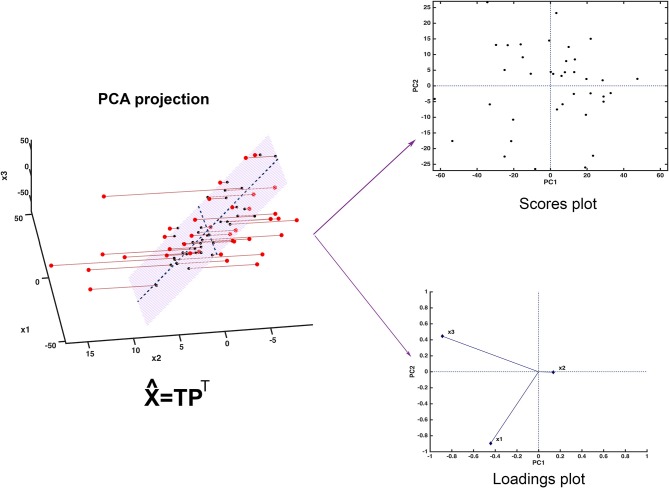
Figure 2.
Graphical illustration of the basics of PCA. The samples, here represented in a three-dimensional space, are projected onto a low-dimensional subspace (highlighted in light red in the leftmost panel) spanned by the first two principal components. Inspection of the data set can be carried out by looking at the distribution of the samples onto the informative PC subspace (scores plot) and interpretation can be then carried out by examining the relative contribution of the experimental variable to the definition of the principal components (loadings plot).

