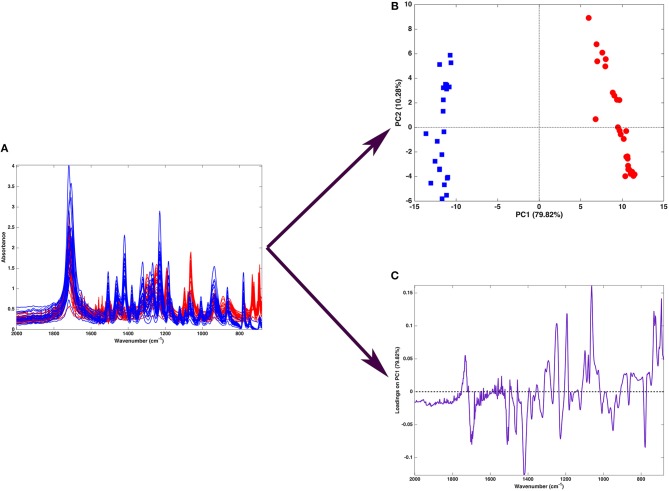
Figure 3.
Graphical illustration of the application of PCA on a spectral (mid-infrared) data. Fifty-one spectra recorded on samples containing either ibuprofen (blue) or ketoprofen (red) are recorded in the region 680–2,000 cm−1 (A). When PCA is applied to such a dataset, one obtains a scores plot (B) showing that two cluster of samples, corresponding to tablets containing ibuprofen (blue squares) or ketoprofen (red circles) are separated along the first component. Interpretation of the observed differences in terms of the spectroscopic signal is made possible by the inspection of the loadings on PC, which are shown in a “spectral-like” fashion in (C).

