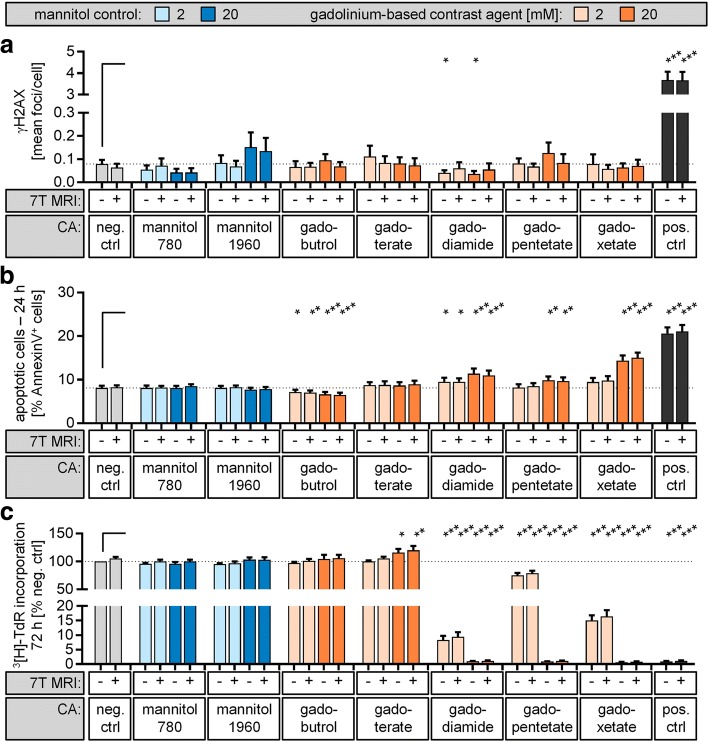
Fig. 2.
Genotoxic and cytotoxic impact of contrast-enhanced 7-T MRI exposure. Isolated lymphocytes were incubated with the indicated class and concentration of gadolinium-based contrast agent. Samples incubated in cell culture medium only (neg. ctrl) or with mannitol solution comparable with the lowest (780 mOsm/kg H2O; gadodiamide) and highest (1960 mOsm/kg H2O; gadopentetate dimeglumine) osmolality of GBCAs served as controls. Additionally, samples were either exposed to 7-T MRI (+) or placed outside the MRI scanner (-) at the same temperature. a The level of DNA double-strand breaks was assessed 15 min after exposure by γH2AX staining and automated foci quantification. Lymphocytes irradiated with 0.5 Gy served as positive controls (pos. ctrl). b Apoptosis rate was quantified after 24 h by Annexin V/propidium iodide staining combined with flow cytometric analysis. Samples treated with 2 μM camptothecin served as positive controls. c For proliferation analysis, lymphocytes were activated with PHA directly after MRI exposure. Level of DNA synthesis was determined after 72 h by [3H]-thymidine incorporation. Lymphocytes treated with 2 μM camptothecin served as positive controls. Diagrams display mean ± standard error of the mean of 12 experiments (***p ≤ 0.001; **p ≤ 0.01; *p ≤ 0.05) and raw data are listed in Additional file 1: Tables S4–S6

