Figure 1.

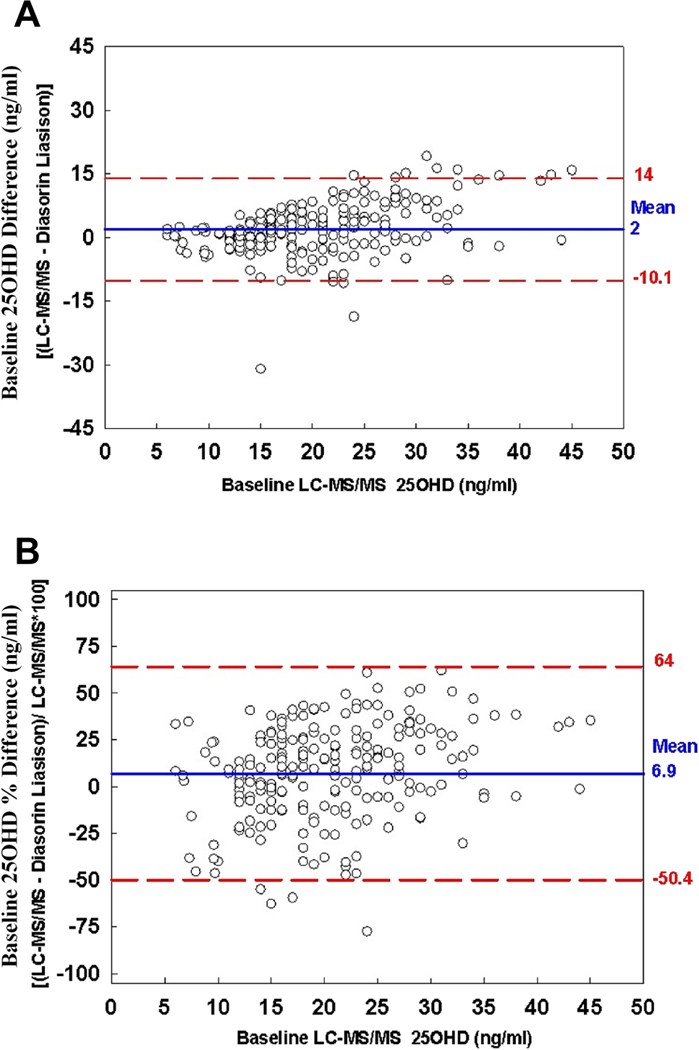
Panel A: Bland-Altman plot of the baseline difference between Diasorin Liaison and LC-MS/MS 25-OHD levels vs. baseline LC-MS/MS 25OHD in 219 subjects (symbols). Solid horizontal line, mean difference between the two assays (or bias); dashed horizontal lines, 95% confidence interval.
Panel B. Bland-Altman plot of the baseline percentage difference [(LC-MS/MS - Diasorin Liaison)/LC-MS/MS*100]. Solid horizontal line, mean difference between the two assays (or bias); dashed horizontal lines, 95% confidence interval.
