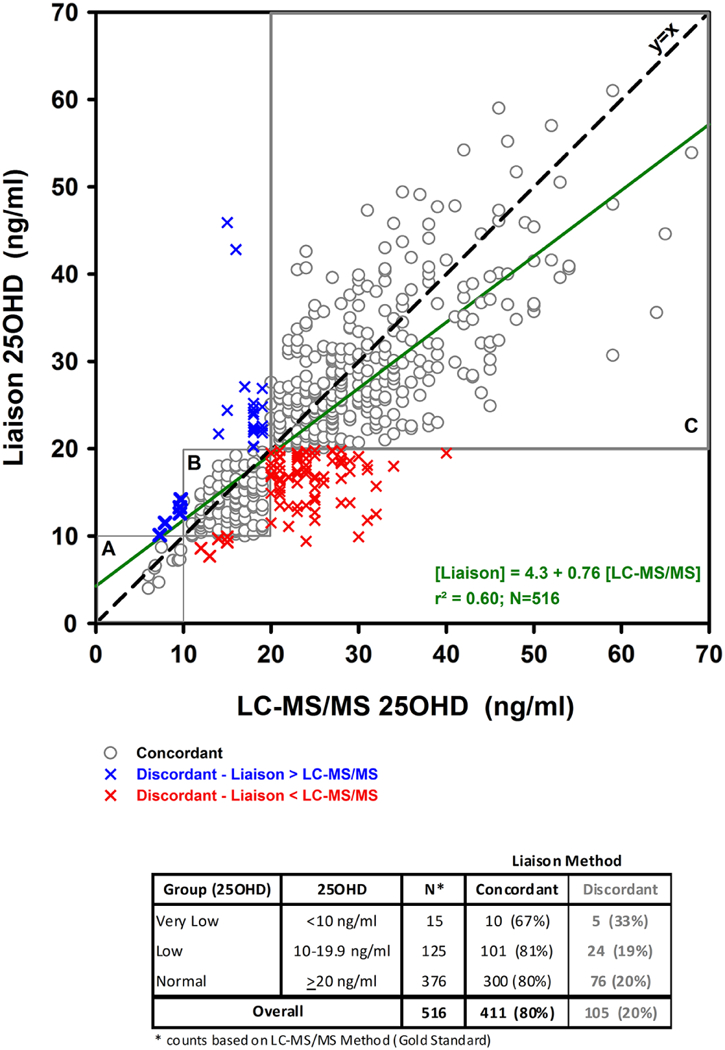
Figure 3. Comparison of Diasorin Liaison vs. LC-MS/MS 25OHD levels in the overall data set (n 516) subjects.

Symbols represent individual data points using both assays. Gray light circles represent concordant points at increasing 25OHD cut-offs [A (<10 ng/ml), B (10–20ng/ml), C (>20 ng/ml). Dashed line, Line of identity; solid line, linear regression model fit with its equation.
