Figure 5.

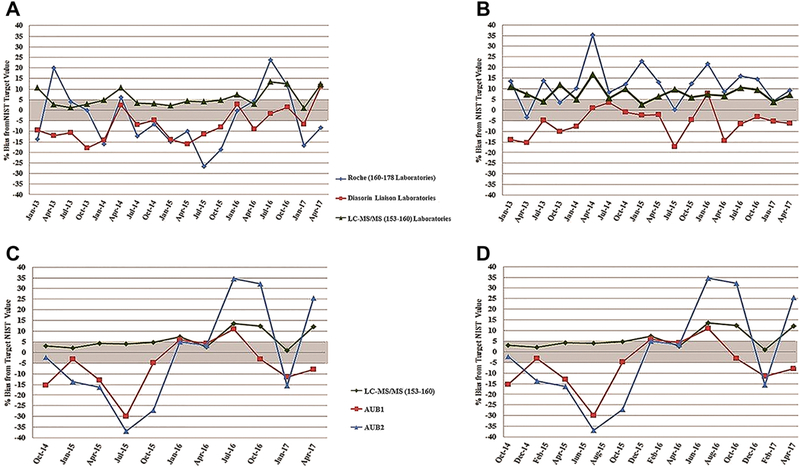
(A and B): Method specific mean % bias from NIST lowest (panel A) and highest (panel B) 25OHD) target values, for the 2 most commonly used platform assay methods/manufacturers and for LC-MS/MS methods. The number of laboratories varied by DEQAS report cycle, as shown in legend, depending on the cycle.
Figure 5 (C and D): Method specific % bias from NIST lowest (Panel C) and highest (Panel D) 25OHD target values, at 2 AUB laboratories.
The mean lowest 25(OH)D NIST target value (panels A and C) obtained by deriving the mean using the lowest 25(OH)D NIST target value for each cycle, over the DEQAS report period 2013–2017: 33.6 ± 8.1 nmol/L (13.4±3.2 ng/ml). Mean highest 25(OH)D NIST target value (panels B and D) obtained by deriving the mean using the highest 25(OH)D NIST target value for each cycle, over the report period 2013–2017: 100.07 ± 16.5 nmol/L (40.0±6.6 ng/ml).
