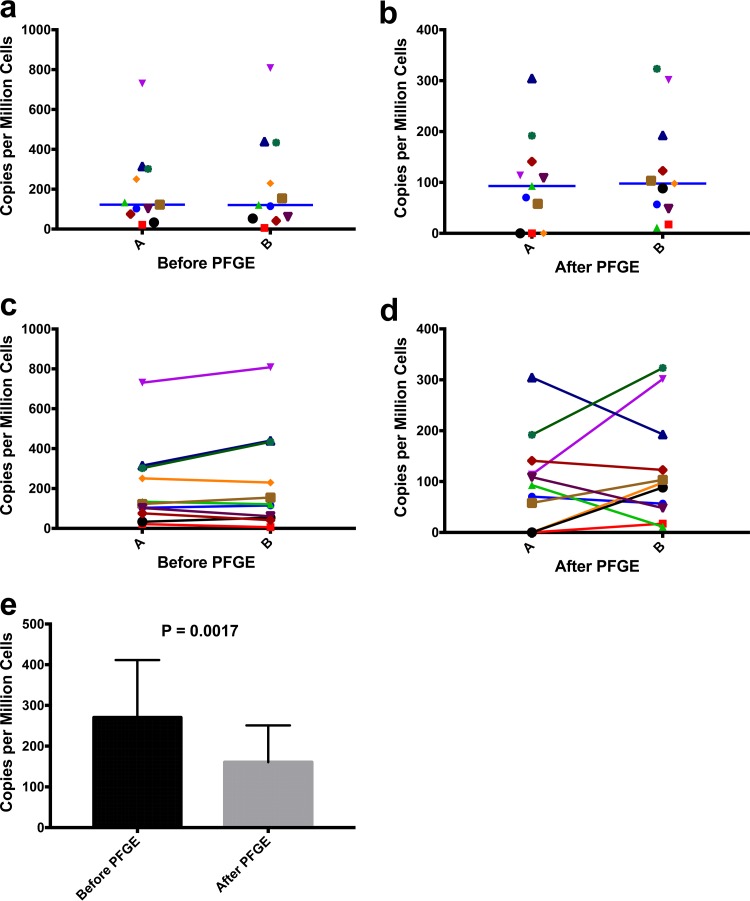
FIG 3.
(a and c) HIV gag DNA copies per million cells before PFGE for complete technical replicates of PBMCs from 11 ART-suppressed subjects. The median for the first replicate (A) was 122.3 copies per million cells (95% CI, 62.6 to 335.5 copies per million cells), and that for the second replicate (B) was 120.9 copies per million cells (95% CI, 59.95 to 388 copies per million cells). By Wilcoxon's paired nonparametric t test, no significant difference was observed between replicates. (b and d) HIV gag DNA copies per million cells after PFGE for complete technical replicates of cells from 11 ART-suppressed subjects. The median for the first replicate (A) was 93 copies per million cells (95% CI, 36.4 to 160.2 copies per million cells), and that for the second replicate (B) was 97.8 copies per million cells (95% CI, 52.7 to 195.3 copies per million cells). By Wilcoxon's paired nonparametric t test, no significant difference was observed between replicates. (e) HIV gag DNA copies per million cells before or after PFGE for PBMCs from 22 ART-suppressed subjects. The median gag copy number before PFGE was 270.4 copies per million cells (95% CI, 193.7 to 486.6 copies per million cells), and that after PFGE was 160.6 copies per million cells (95% CI, 89.6 to 399.5 copies per million cells). The median genomic DNA recovery percentage was 22.5% (95% CI, 20.4 to 29.6%), as determined with the RPP30 gene. Wilcoxon's paired nonparametric t test determined a significant difference for results before versus after PFGE (P = 0.0017).

