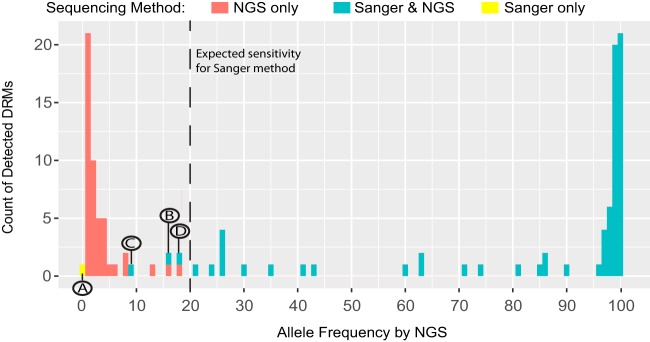
FIG. 2.
Histogram of DRM frequency by method of sequencing. Number of DRMs detected at each allele frequency, by NGS only (red), by both Sanger and NGS (blue), and by Sanger only (yellow). Letters A to D highlight disagreements found between NGS and Sanger variant calls made at the 20% allele frequency threshold expected for Sanger sequencing. The letters correspond with those shown in Fig. 3.

