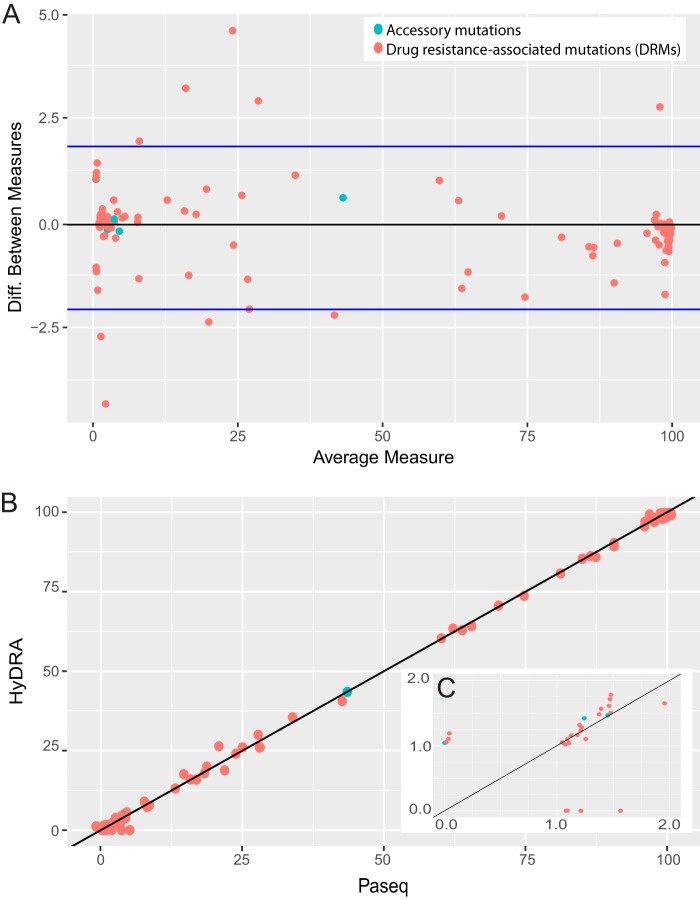
Fig. 4.
Concordance of allele frequency calls by HyDRA and PASeq variant callers. (A) Bland-Altman plot comparing allele frequency measurements for variants called by PASeq and HyDRA. (B) Correlation plot of allele frequency measurements for variants called by PASeq (x axis) versus HyDRA (y axis). Accessory mutations are in blue, and DRMs are labeled in red. The accessory mutation S168G (blue) was called by both callers at 43% allele frequency. (C) Zoomed-in view of 1 to 2% frequency range (cluster of observations in bottom left corner of panel B). All true zero values were assigned a random uniform value from 0 to 1% (B) and 0 to 0.1% (C).

