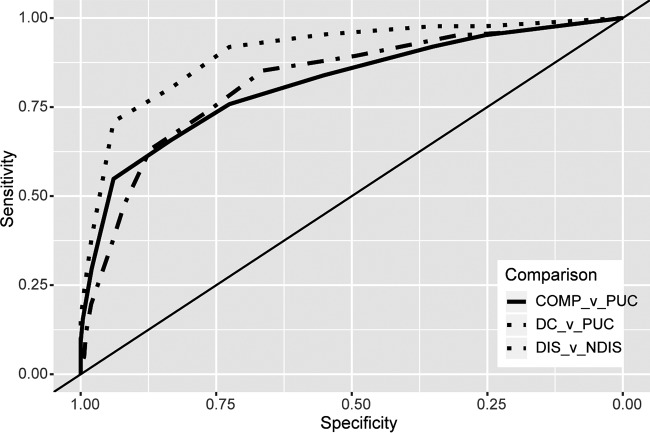
FIG 2.
ROC plots. Overlaid ROC plots show the classification accuracy for DC versus PUC cases (AUC, 0.903 [95% CI, 0.86 to 0.94]) (a perfect classifier would have a sensitivity and specificity of 1 along all points and thus would have an AUC of 1), complicated (COMP) versus uncomplicated cases (AUC, 0.815 [95% CI, 0.77 to 0.86]), and disseminated (DIS) versus nondisseminated (NDIS) cases (AUC, 0.822 [95% CI, 0.78 to 0.87]). The x axis is reversed and is labeled “specificity,” as opposed to “1 − specificity.”

