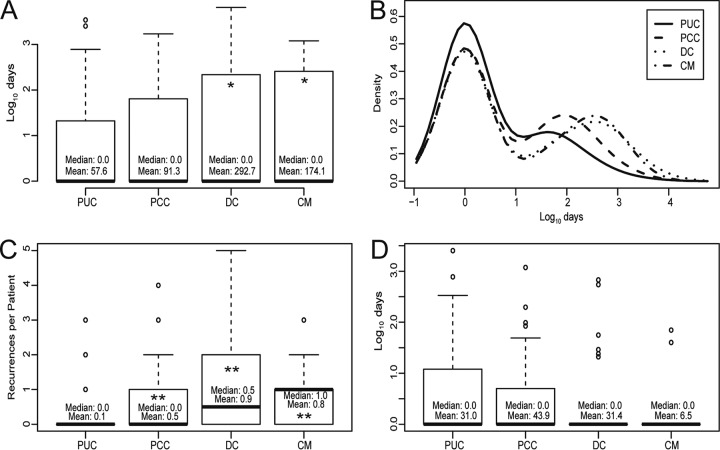
FIG 3.
Maximal titer development kinetics. (A and D) Boxplots showing time to maximal titer for each group, including serologic recurrences (A) and excluding serologic recurrences (D). (B) Histogram density plot of time to maximal titer for each group, showing numerous outliers in each group, ranging from 102 days to >103 days. Outliers were more abundant for more complicated infections. (C) Number of recurrences per patient in each group, which contributed to the overestimated time to maximal titers in panel A. Titer data for boxplot analyses were log10 transformed to account for numerous high-end outliers. Statistical analyses were performed with untransformed data. *, Student's t test, P < 0.05; **, Student's t test, P < 3 × 10⁻⁴.

