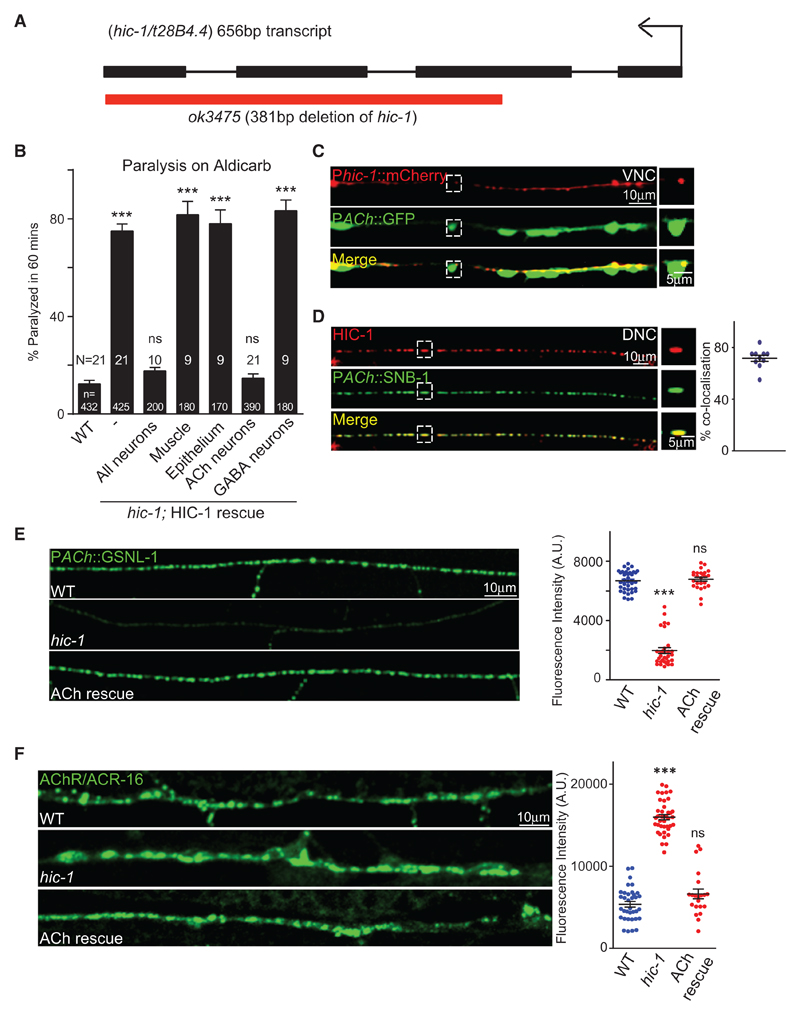
Figure 1. Mutants in hic-1 Are Hypersensitive to Aldicarb.
(A) Illustration of the genomic region of hic-1 introns and exons. The red bar indicates the hic-1 (ok3475) deletion. Also see Figure S1.
(B) Percentage paralysis of C. elegans at the 60 min time point. Attempted rescue of the Aldicarb phenotype using the following promoters; Prab-3 (pan-neuronal), Pmyo-3 (body-wall muscles), Plet-413 (epithelial cells), Punc-17 (cholinergic neurons), and Punc-25 (GABAergic neurons). In all Aldicarb bar graphs, N is the number of trials and n is the total number of animals tested per genotype (~20 animals/trial).
(C) Expression of phic-1::mCherry in the ventral nerve cord (VNC) cholinergic neurons that are tagged with GFP. n > 10. Also see Figure S2.
(D) The punctate expression of the HIC-1::mCherry overlaps with the SNB-1::GFP at the cholinergic synapses of the dorsal nerve cord (DNC). Percentage co-localization of HIC-1 was calculated using the following formula: (number of HIC-1 puncta co-localized with SNB-1/total number of HIC-1 puncta) × 100 in 100 μm. n = 10. Also see Figure S2.
(E) Representative images and quantitation of Gelsolin (GSLN-1)::GFP expressed in a subset of cholinergic neurons. WT (n = 35), hic-1 (n = 28), and hic-1; PACh::HIC-1 (n = 25).
(F) Representative images and quantitation of fluorescence intensity of the C. elegans NMJ expressing ACR-16::GFP transgene in the body-wall muscles in WT, hic-1, and hic-1; PACh::HIC-1 animals. n = 35 (WT), n = 40 (hic-1), and n = 25 (hic-1; PACh::HIC-1). Also see Figure S3.
p values were calculated using one-way ANOVA and Bonferroni’s multiple-comparison test. ***p < 0.001. ns, not significant. Data are represented as mean ± SEM.

