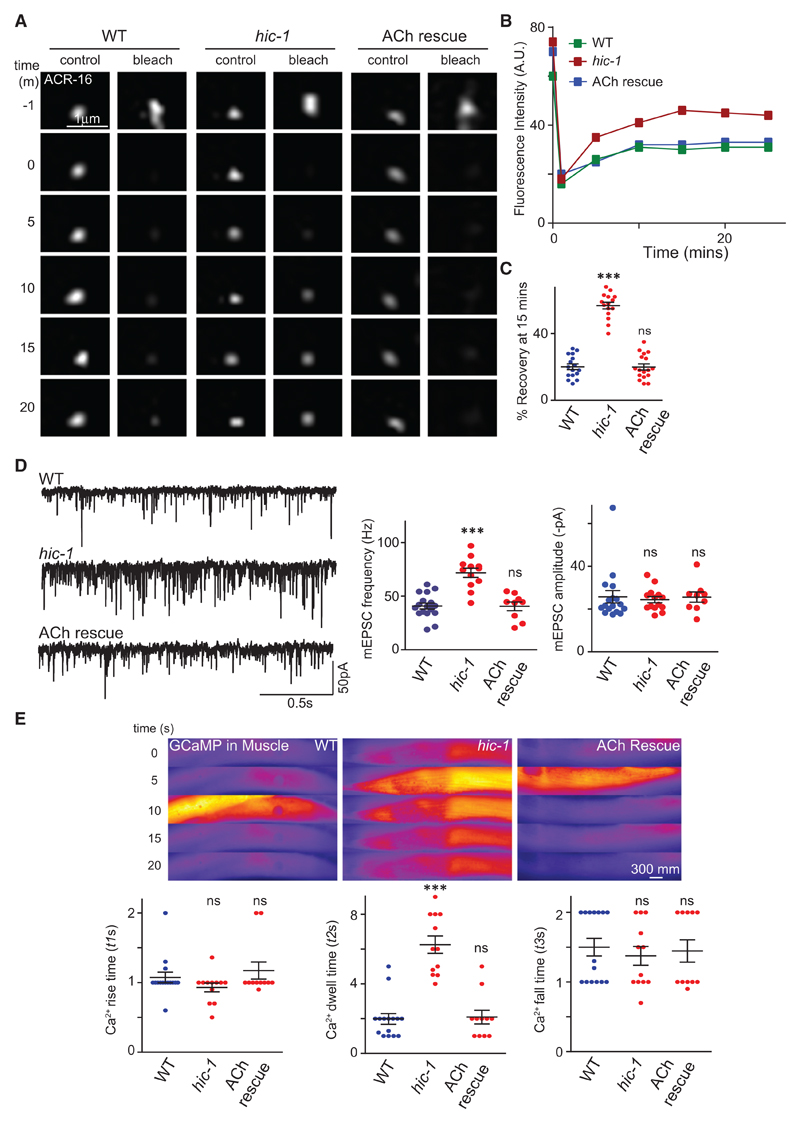
Figure 2. Muscle Responsiveness Is Aberrant in hic-1-Mutant Animals.
(A) Representative time-lapse images at multiple time points of single punctum of ACR-16::GFP; −1 m refers to the time before bleaching. The punctum was photobleached at the 0 min time point. The fluorescence recovery and the percentage of recovery were calculated till the fluorescence intensity reached a plateau (at the 15 min time point).
(B) Recovery rate of a single ACR-16::GFP puncta after photobleaching in WT, hic-1, and hic-1; PACh::HIC-1 animals.
(C) Percentage of recovery at the 15 min time point. The number of puncta analyzed and the genotypes tested were n = 15 (WT), n = 18 (hic-1), and n = 13 (hic-1; PACh::HIC-1).
(D) Whole-cell recordings on the muscles were performed to record endogenous acetylcholine (ACh) release (mEPSCs) from WT, hic-1, and hic-1; PACh::HIC-1 animals. The mEPSC frequency is greater in hic-1-mutant C. elegans and is rescued by expressing HIC-1 in cholinergic neurons. The mEPSC amplitude was not significantly different across genotypes. The animals tested were n = 17 (WT), n = 12 (hic-1), and n = 9 (hic-1; PACh::HIC-1). Also see Figure S4A.
(E) GCaMP is expressed in the body-wall muscles using a muscle-specific promoter. Representative time-lapse fluorescence images and data analysis of calcium transients in the C. elegans muscles are shown here. The hic-1 mutants show increased calcium transients, which are rescued by expressing HIC-1 in cholinergic neurons. The dot-plot graphs represent rise time (t1s), dwell time (t2s), and fall time (t3s) constants for calcium transients in different genotypes. A representation of the time constants is indicated in Figure S4B. Animals tested: n = 15 (WT), n = 12 (hic-1), and n = 11 (hic-1;PACh::HIC-1). Also see Figures S4B and S4C.
p values were calculated using one-way ANOVA and Bonferroni’s multiple-comparison test. ***p < 0.001; ns, not significant. Data are represented as mean ± SEM.

