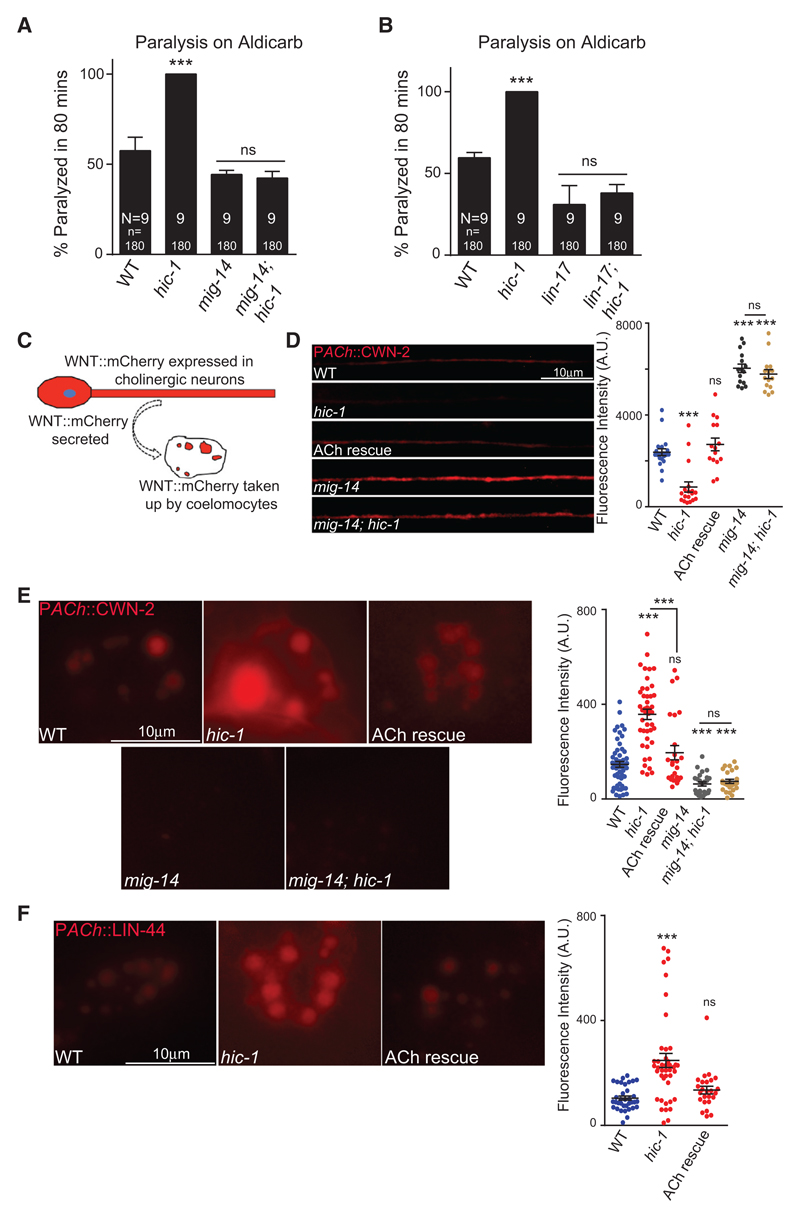
Figure 3. Mutants in hic-1 Show Increased Wnt Release.
(A) Aldicarb assay for double mutants containing wntless/mig-14 and hic-1 along with control animals.
(B) Aldicarb assay for frizzled/lin-17; hic-1 mutants along with control strains.
(C) Illustration of the coelomocyte uptake assay for Wnts.
(D) Wnt/CWN-2 fluorescence intensity along the DNC from WT (n = 20), hic-1 (n = 18), HIC-1 rescue in ACh neurons (n = 15), mig-14 (n = 15), and mig-14; hic-1 (n = 15) animals.
(E) Representative images and dot plot of coelomocyte fluorescence intensity of Wnt/CWN-2::mCherry in cholinergic neurons from WT (n = 57), hic-1 (n = 44), PACh::HIC-1 (n = 25), mig-14 (n = 25), and mig-14; hic-1 (n = 25) animals. Also see Figure S5.
(F) Representative images and quantitation of coelomocyte fluorescence intensity in animals expressing Wnt/LIN-44::mCherry in cholinergic neurons. WT (n = 38), hic-1 (n = 42), and hic-1; PACh::HIC-1 (n = 23). Also see Figure S5.
p values were calculated using one-way ANOVA and Bonferroni’s multiple-comparison test. ***p < 0.001; ns, not significant. Data are represented as mean ± SEM.

