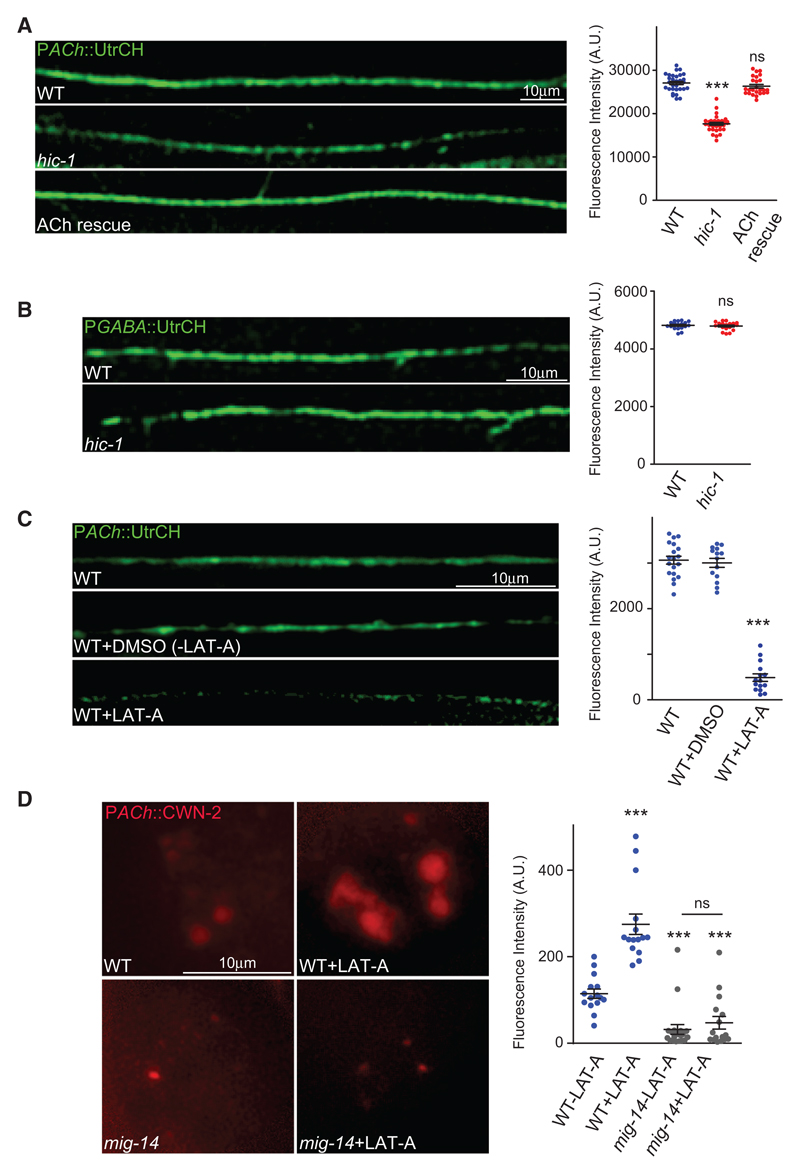
Figure 4. HIC-1 Is Required to Maintain a Normal Actin Cytoskeleton at Cholinergic Synapses.
(A) Representative images and quantitation of PACh::GFP-UtrCH fluorescence intensity along the DNC of C. elegans. WT (n = 30), hic-1 (n = 27), PACh::HIC-1 (n = 23).
(B) Representative images of the DNC and quantitation for PGABA::GFP-UtrCH in WT (n = 15) and hic-1 (n = 17) mutant animals.
(C) Representative images and quantitation of the DNC of animals expressing PACh::GFP-UtrCH. WT (n = 19) and WT animals injected with DMSO (n = 14) or DMSO and latrunculin-A (LAT-A) (n = 15) were imaged for this experiment.
(D) Representative images and quantitation of coelomocyte fluorescence in WT and mig-14 strains that express PACh::Wnt/CWN-2::mCherry. WT injected with DMSO (n = 20), WT injected with LAT-A (n = 15), mig-14 injected with DMSO (n = 20), and mig-14 injected with LAT-A (n = 16).
In (A), (C), and (D), p values were calculated using one-way ANOVA and Bonferroni’s multiple-comparison test. In (B), p values were calculated using two-tailed unpaired Student’s t test. ***p < 0.001; ns, not significant. Data are represented as mean ± SEM.

