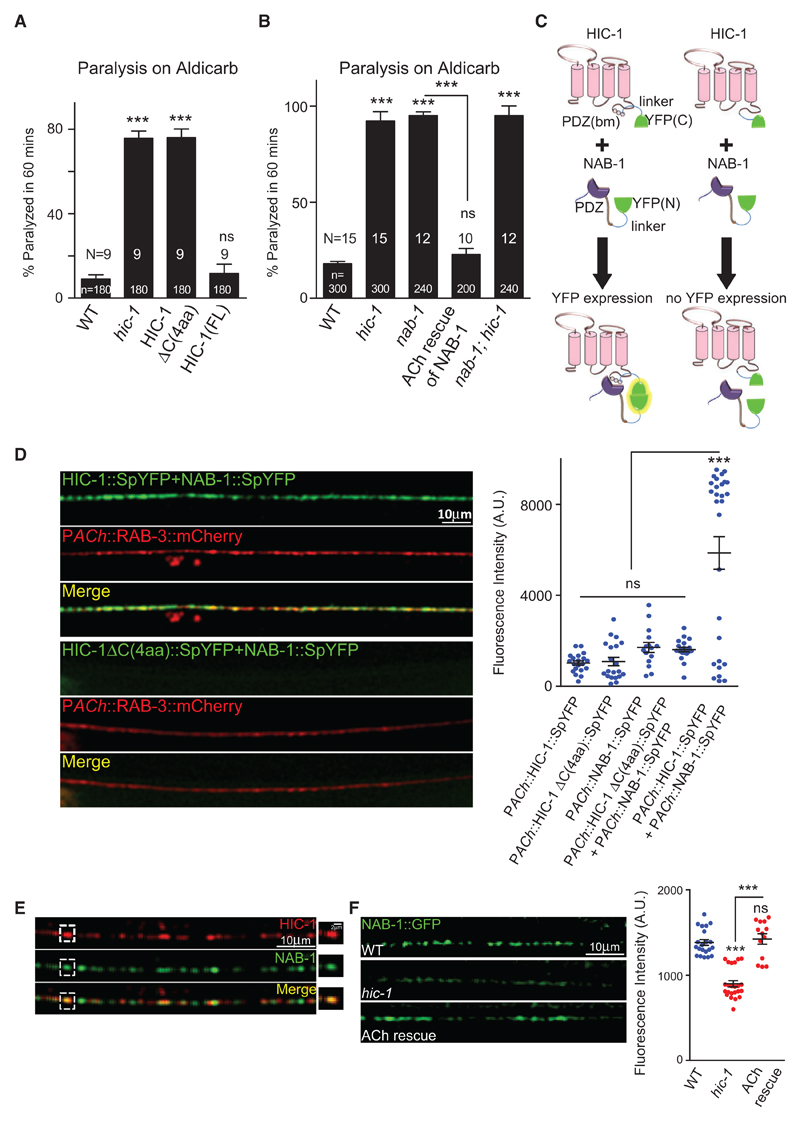
Figure 5. HIC-1 Interacts with Neurabin through Its PDZ(bm).
(A) Percentage paralysis of C. elegans at 60 min after Aldicarb exposure. HIC-1ΔC(4aa) indicates a deletion of the last four amino acids from C terminus of HIC-1. Also see Figure S6A.
(B) Percentage paralysis of C. elegans at 60 min after Aldicarb exposure indicating genetic interaction between hic-1 and nab-1. Also see Figure S6B.
(C) Schematic indicating possible results of the BiFC assay between HIC-1 and NAB-1. HIC-1 (pink) is tagged with the C-terminal half of YFP (green) via a linker sequence (blue), the PDZ(bm) is indicated as circles. The C terminus of NAB-1 is tagged to the N-terminal half of YFP (green) using a linker sequence (blue). The interaction between NAB-1 and HIC-1 leads to reconstitution of YFP fluorescence (yellow glow), while no fluorescence is detected in the absence of the PDZ(bm) of HIC-1.
(D) Representative images and quantification of the DNC of WT animals expressing either HIC-1::SpYFP and NAB-1::SpYFP together or HIC-1ΔC(4aa) and NAB-1::SpYFP together in the cholinergic neurons. The cholinergic synapses are labeled with RAB-3::mCherry. Right: quantification of the YFP reconstitution between HIC-1 and NAB-1 along with multiple controls. Also see Figures S6C and S6D.
(E) Representative image of the DNC of C. elegans expressing HIC-1::mCherry and NAB-1:GFP. Partial co-localization was seen for HIC-1 and NAB-1 (n > 10).
(F) Representative images and quantitation of NAB-1::GFP fluorescence intensity along the DNC in WT (n = 21), hic-1 (n = 23), and hic-1; PACh::HIC-1 (n = 13) animals. Also see Figure S6E.
p values were calculated using one-way ANOVA and Bonferroni’s multiple-comparison test. ***p < 0.001; ns, not significant. Data are represented as mean ± SEM.

