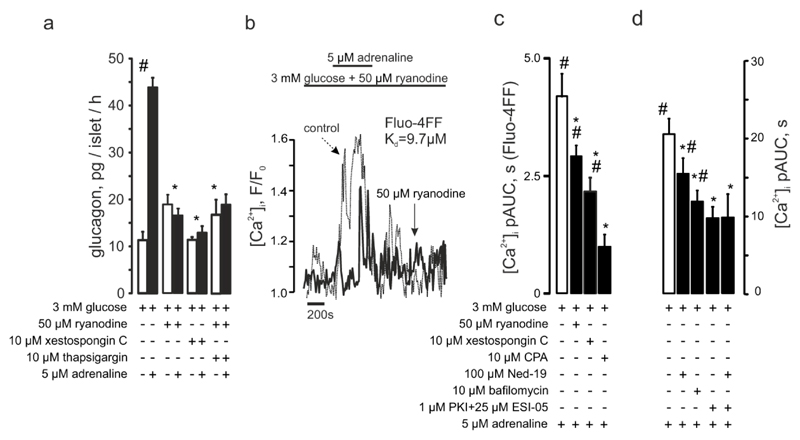
Figure 4. Adrenaline-induced glucagon secretion involves intracellular Ca2+ release.
(a) Glucagon secreted from isolated NMRI mouse islets at 3mM with or without adrenaline and ryanodine, xestospongin C or thapsigargin as indicated. p<0.05 vs the basal (#) or vs the effect of glucose + adrenaline (*). (b) Representative recording of the effect of ryanodine on adrenaline-induced [Ca2+]i increases visualized using Fluo4FF. The control (dashed) is superimposed with the experimental trace. (c) [Ca2+]i upon adrenaline stimulation alone (n=23) or in the presence of ryanodine (n=22), xestospongin C (n=30) or CPA (n=14), as measured using Fluo4FF. (d) [Ca2+]i upon adrenaline stimulation alone or in the presence of Ned-19 (n=28), bafilomycin (n=36), myr-PKI and ESI-05 (n=31) or myr-PKI + ESI-05 + Ned-19 (n=21). p<0.05 vs the basal (3 mM glucose + antagonist) of the same recording (#) or vs the effect of 3 mM glucose + adrenaline (*).

