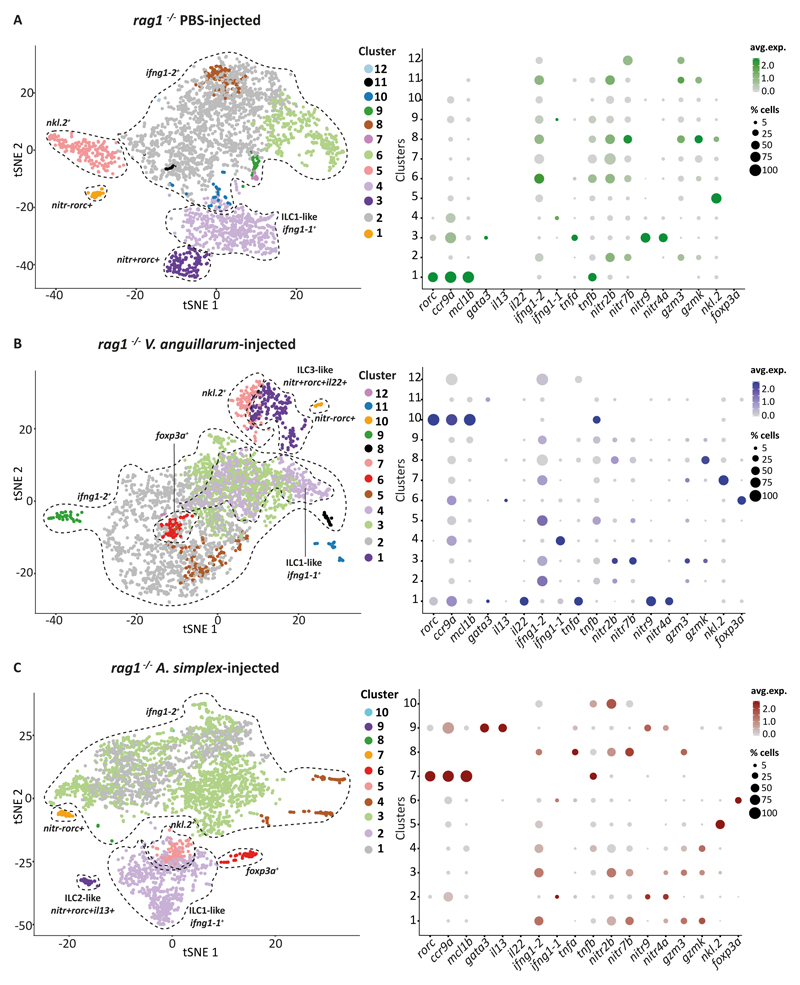
Figure 2. Analysis of the lck+cells, collected from the gut of rag1-/- zebrafish.
2D projection of tSNE analysis of 10x RNAseq data showing heterogeneity of innate lymphoid cells. Dotplots show the level of expression of marker genes and percentage of cells per cluster that express the gene of interest.

