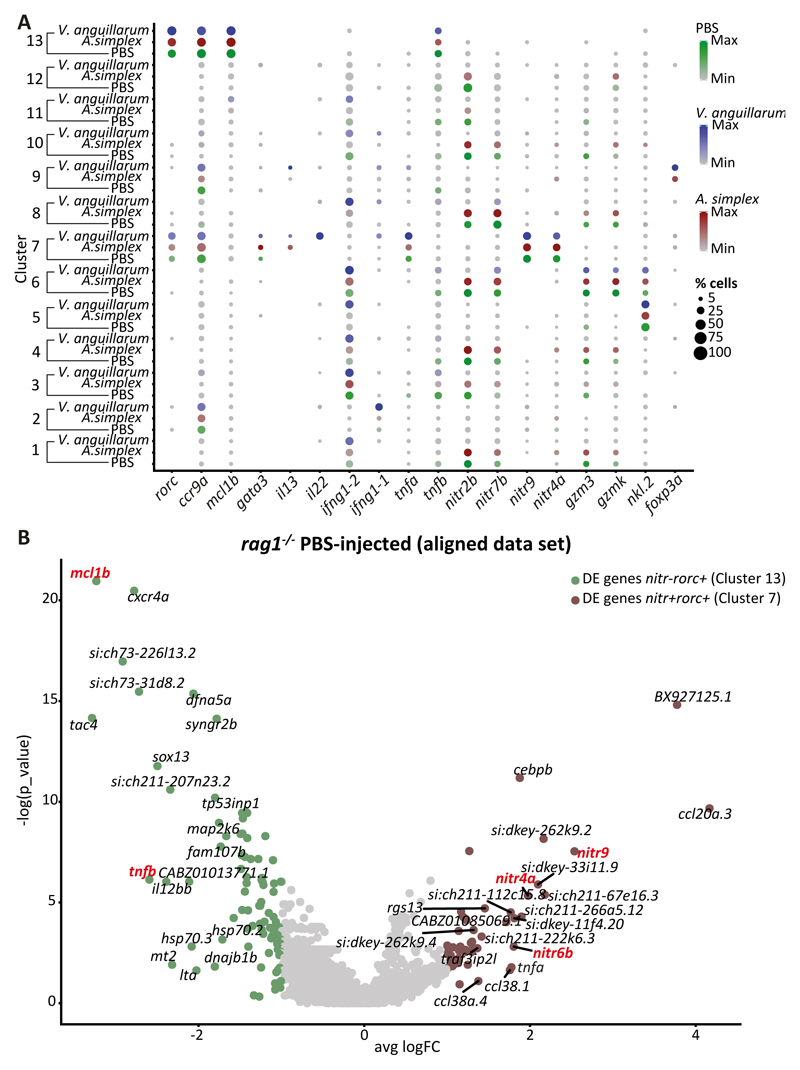
Figure 4. Integrated analysis of PBS - V. anguillarum- A. simplex-injected rag1-/- zebrafish.
A. Dotplot with the expression level of selected marker genes in each of the clusters. The size of the dots indicates the percentage of cells within the cluster that express the gene of interest; each cluster contains cells from three different conditions. B. Volcano plot showing the top 20 differentially expressed genes between nitr+rorc+(Cluster 7) and nitr-rorc+(Cluster 13) cells originated from rag1-/- PBS-injected zebrafish using aligned dataset.

