Figure 3.
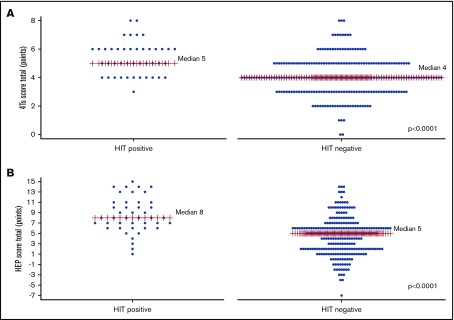
Plot of HEP score and 4Ts score by adjudicated HIT status. The distribution of 4Ts scores (A) and HEP scores (B) according to adjudicated HIT status are shown. Median scores are labeled and denoted with red lines. The median score was greater in HIT+ patients than in HIT− patients for both the HEP score and 4Ts score (P < .0001).

