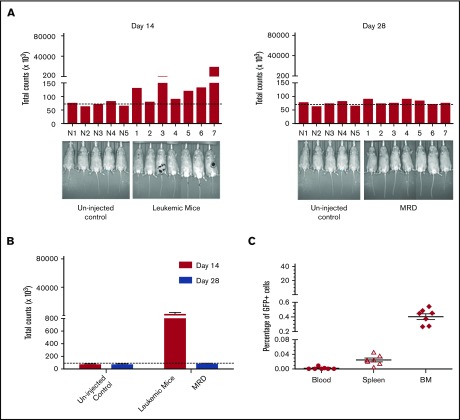
Figure 6.
Development of an MRD model in 32Dp210 leukemia. (A) In vivo bioluminescence analyses demonstrate efficacy of GCV treatment in mice inoculated with 32Dp210-luc-HSV-TK+ leukemia. Mice were inoculated IV with 32Dp210-luc-HSV-TK+ leukemia on day 0 and began treatment with GCV (50 mg/kg) beginning at day 14 for 2 weeks. Left panel: day 14 after tumor inoculation prior to GCV treatment; right panel: day 28 after tumor inoculation and day 14 of GCV treatment. Leukemic burden as measured by total photon counts per mouse is depicted on the y-axis. Lanes N1 to N5: normal non-tumor-bearing mice injected with luciferin as background controls; lanes 1-7 depict in vivo bioluminescence assays of 32Dp210-luc-HSV-TK+ leukemia-bearing mice after 14 days of GCV administration. (B) Bioluminescence studies demonstrate induction of remission in 32Dp210-luc-HSV-TK+ tumor-bearing mice with background levels of bioluminescence after GCV treatment at day 28. Remission was arbitrarily defined as a level of bioluminescence comparable to background levels in luciferin-injected non-tumor-bearing mice (n = 5) (uninjected controls, left). Fourteen days after tumor inoculation, the mean photon counts ± SEM in 32Dp210-luc-HSV-TK+ leukemic mice were plotted on the y-axis after imaging (leukemic mice, red bar on right). Background controls for MRD in normal mice 2 weeks after GCV administration (blue bar, left). MRD (blue bar, far right) indicates the level of in vivo bioluminescence in leukemic mice after 2 weeks of GCV treatment (n = 7). (C) GCV-mediated remission induction demonstrated by in vivo bioluminescence studies correlates with induction of pathological remission. The frequency of 32Dp210-GFP+HSVTK+ cells (MRD) in peripheral blood, spleen, and bone marrow of GCV-treated, responding mice was quantified by flow cytometric analyses after 14 days of GCV administration. The percentage of GFP+ cells in blood (filled circles), spleen (open triangles), and bone marrow (filled diamonds) from each mouse achieving remission (as defined by bioluminescence studies above) are indicated on the y-axis. The mean for each group is designated by a horizontal line for each group ± SEM. Mice with remission, as defined by in vivo bioluminescence analyses that showed background levels of photon counts/subject, had detectable leukemia (MRD), but <5% leukemic cells in all tissues examined, consistent with the clinical/pathological definition of leukemic remission.

