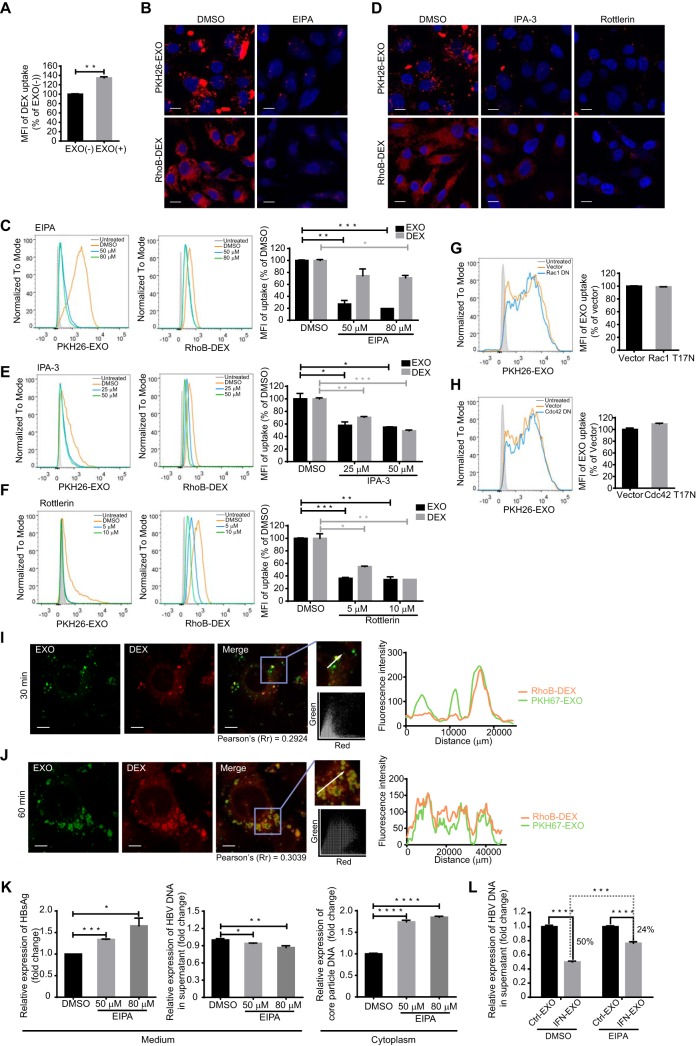
FIG 4.
Exosome internalization involves macropinocytosis. (A) Preincubation with exosomes increased dextran uptake in HepG2 cells. RhoB-dextran (RhoB-DEX) uptake by HepG2 cells pretreated with exosomes [EXO(+)] was analyzed by flow cytometry, and the MFI is normalized to that of untreated cells [EXO(−)]. (B and C) Confocal images (B) and flow cytometry analysis (C) of exosome and dextran internalization by HepG2 cells treated with EIPA. Scale bars: 10 µm. For flow cytometry analysis, MFIs (right) are normalized to that of DMSO-treated cells. (D to F) Confocal images (D) and flow cytometry analysis (E and F) of exosome and dextran internalization by HepG2 cells treated with IPA-3 or rottlerin. Scale bars: 10 µm. For flow cytometry analysis, MFIs (right) are normalized to that of DMSO-treated cells. (G and H) Exosome uptake is independent of Rac1 or Cdc42. Flow cytometry analysis of exosome internalization by HepG2 cells transfected with EGFP-Rac1 dominant negative mutant (G) or EGFP-Cdc42 dominant negative mutant (H), followed by incubation with PKH26-labeled exosomes. Transfected cells (EGFP+) are gated, and the uptake of exosomes among transfected cells (EGFP+ PKH26+) was analyzed as described above. (I and J) Internalized exosome colocalized with dextran 30 min (I) and 1 h (J) after internalization. The colocalization of Rho-dextran (red) with PKH67-labeled exosomes (green) was analyzed as described above. Scale bars: 5 µm. (K) HepG2.2.15 cells were treated with DMSO or EIPA. The level of HBsAg in the culture medium (supernatant) was detected by ELISA. HBV DNA in the culture medium and intracellular core particle DNA were quantified by qPCR. (L) Blockade of IFN-α-induced anti-HBV activity transmission by EIPA treatment. HepG2.2.15 cells were pretreated with DMSO or EIPA, and the drugs were present continuously during following incubation with IFN-EXO or Ctrl-EXO. HBV DNA levels in the medium were quantified by qPCR. The error bars indicate the SD. *, P < 0.05; **, P < 0.01; ***, P < 0.001; ****, P < 0.0001 (Student’s t test). The data are representative of those from three independent experiments.

